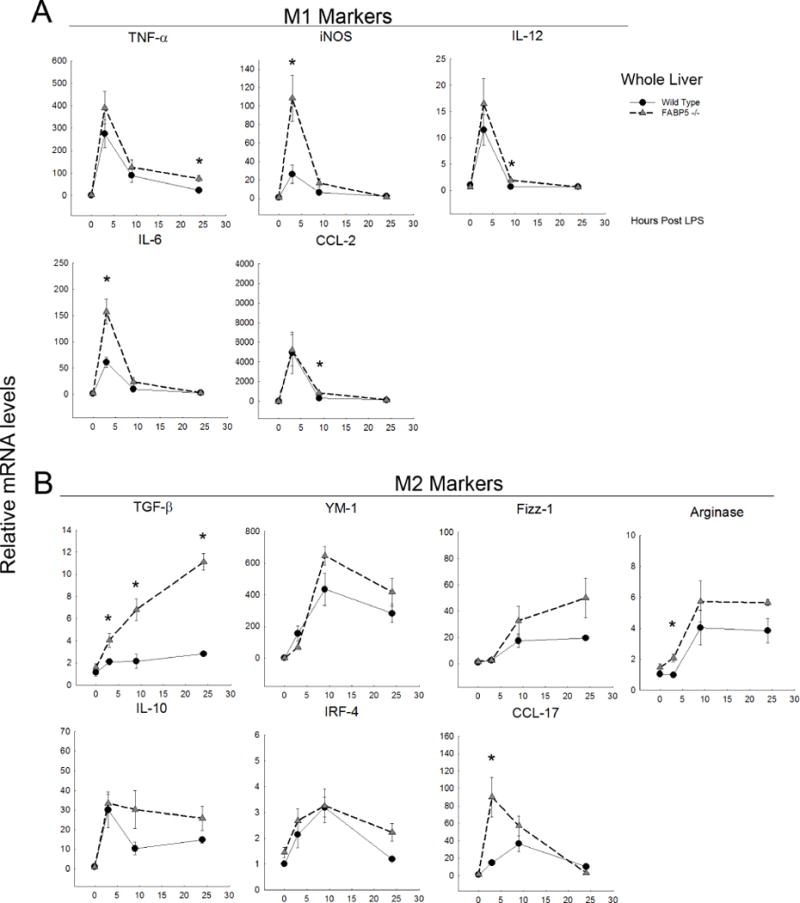
Figure 6. LPS time course and related M1/M2 gene expression in whole liver.

Relative mRNA levels of cytokines in wild type and FABP5−/− whole liver treated with LPS for 0, 3, 9, or 24 hours. Cytokine expression was analyzed by real-time PCR and normalized to the housekeeping gene 18S rRNA. Data are expressed as means ± SE. A: M1-associated markers. B: M2-associated markers.
