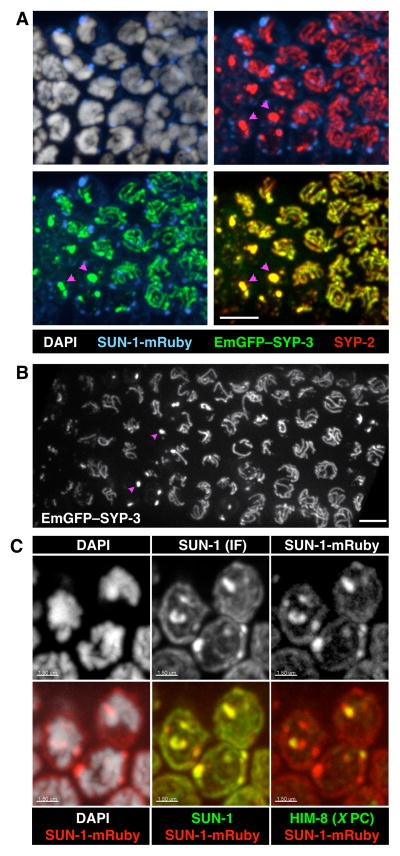
Figure 1. Fluorescent reporters for the synaptonemal complex.
(A) Maximum intensity projections of 3D images of the transition zone region of a fixed gonad from an EmGFP-SYP-3; syp-3; SUN-1-mRuby hermaphrodite, stained with antibodies against SYP-2 and DAPI. EmGFP-SYP-3 and SUN-1-mRuby were visualized by their intrinsic fluorescence. Meiosis progresses from left to right in these images. Each image shows two superimposed channels. Pink arrowheads point to examples of SC aggregates (polycomplexes). Scale bar = 5 μm. See also Figures S1 & S2.
(B) Projection of the transition zone region from a live EmGFP-SYP-3; syp-3 worm. Meiotic progression is from left to right. Pink arrowheads mark examples of polycomplexes. Scale bar = 5 μm. A 3D rendering of the same image stack is shown in Movie 3. See Figure S3A for an image of an entire gonad.
(C) Maximum intensity projections of transition zone nuclei from a SUN-1-mRuby adult hermaphrodite stained with antibodies against SUN-1 and HIM-8, and DAPI. SUN-1-mRuby was visualized by its intrinsic fluorescence. SUN-1 immunofluorescence colocalizes with SUN-1-mRuby. HIM-8, marking the X chromosome PCs, colocalizes with one of the SUN-1 patches. Scale bars = 1.5 μm. See Figure S3B for an image of an entire gonad.

