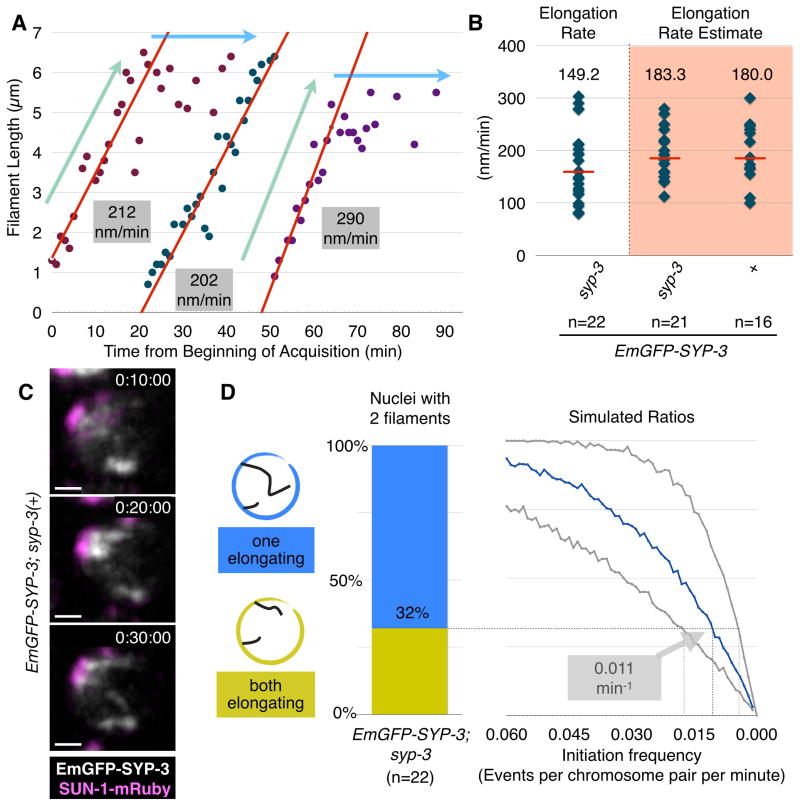
Figure 3. Quantification of SC initiation and extension.
(A) Plots of elongating SC filaments in selected nuclei. Data for each SC is shown in a different color. The ‘elongating’ and ‘constant’ portions of the plots are designated with light blue and green arrows, respectively. The portion of each plot from which the elongation rate was determined is shown as a red line. Notably, new filaments appear and elongate at similar rates even after more than 50 mins of imaging, indicating that SC assembly is not markedly affected by our imaging conditions.
(B) Plots showing the distribution of SC elongation rates based on many individual examples from the indicated genotypes. Median values are indicated by red bars and their numerical values are reported above the distribution. The shaded distributions reflect estimated rates based on analysis at lower temporal resolution. Note that under the slower acquisition conditions, animals were subjected to 10–20-fold less illumination light, yet the elongation rate was equivalent to that measured in data sets with higher temporal resolution, indicating that SC assembly is not highly photosensitive under our conditions.
(C) An example of synapsis progression in an EmGFP-SYP-3; SUN-1-mRuby hermaphrodite imaged at low temporal resolution (every 10 minutes). Two nascent filaments appear between timepoints 0:10:00 and 0:30:00. Scale bar = 1 μm.
(D) Estimation of initiation rates based on analysis of fixed nuclei. We identified nuclei with two visible SC filaments in high-resolution 3D images of fixed gonads stained with antibodies against SC proteins, and classified each filament as either ‘partial’ (<3.5μm) or ‘complete’ (≥3.5μm). Left, the ratio of nuclei with two incomplete (elongating) filaments versus nuclei with one complete filament and one elongating filament. Right, expected ratios derived from simulations with varying initiation frequencies and elongation rates; the x-axis indicates the simulated initiation frequency, while the different curves correspond to different elongation rates: the blue curve reflects the median measured rate (149nm/min), while the gray curves correspond to the minimum and maximum observed elongation rates (80 and 300 nm/min, respectively). Our measured rate of SC elongation and the ratio between nuclei harboring one versus two elongating filaments yield an initiation frequency of 0.011 per chromosome per minute (range: 0.005–0.019). See also Figure S4.

