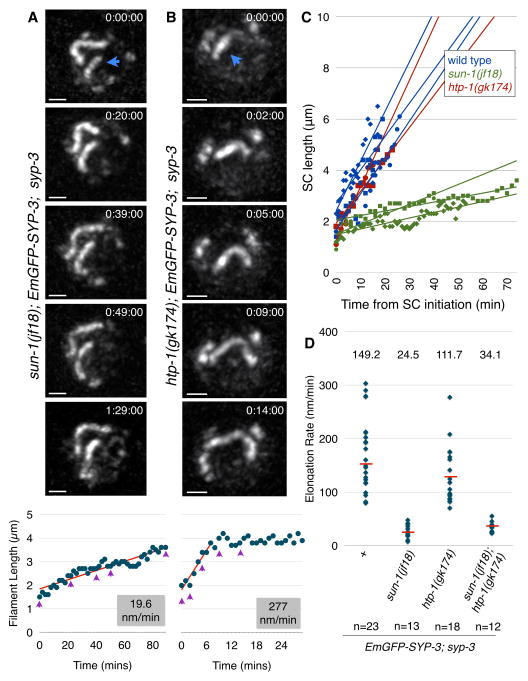
Figure 4. Dynein-driven chromosome motion promotes SC elongation.
(A–B) Partial Z-projections of selected timepoints of nuclei imaged every 1 min. The nascent filament is marked with a blue arrowhead. Scale bars = 1 μm. Filament lengths over time are plotted below. The slope of the elongating portion of the plot is shown in red. Purple arrowheads indicate the timepoints shown above.
(A) A nucleus from an EmGFP-SYP-3; syp-3; sun-1(jf18) hermaphrodite. Note that the two synapsed chromosomes barely move relative to each other, reflecting the absence of dynein-driven chromosome motions (the full recording is shown in Movie 8).
(B) A nucleus from an EmGFP-SYP-3; syp-3; htp-1(gk174) hermaphrodite (the full recording is shown in Movie 9).
(C) Representative plots of elongating filaments from the indicated genotypes. Times are relative to the initiation of SC assembly.
(D) Distributions of SC elongation rates measured from the indicated genotypes. The median is indicated by a red bar and its numerical value is reported above the distribution.

