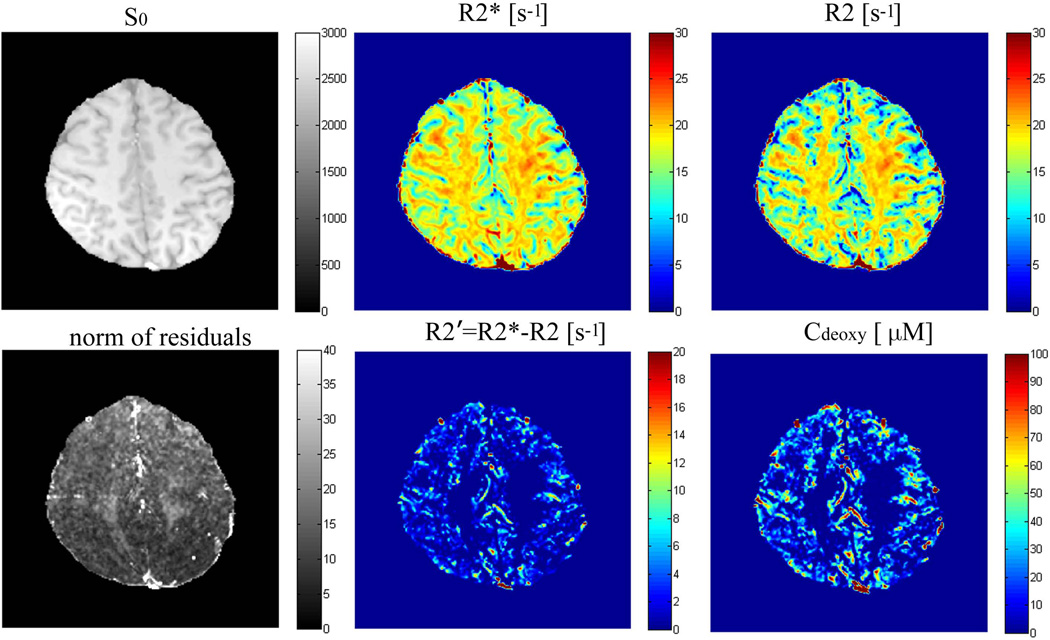
Figure 3.
Fitting results and parameter maps from one subject. S0 is a T1-weighted image which is a square root of the fitting amplitude; R2* is the apparent transverse decay rate obtained by fitting to data a mono-exponential function, Eq. [9], without accounting for the BOLD effect; R2 is the transverse decay rate after removal the BOLD effect, Eq. [2]; also shown are the R2' map (defined by the differences of R2* and R2) and Cdeoxy map, Eq. [8]. Both these maps have higher values at the location of large veins. Residual map shows values mostly less than 1% of the total signal.

