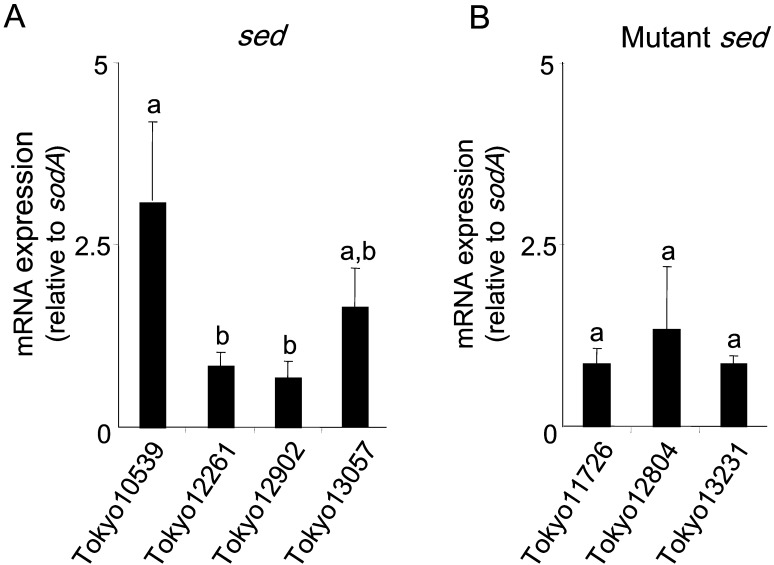
Fig. 5.
Gene expression profiles in each of the seven isolates that originated from staphylococcal food poisoning outbreaks. (A)sed and (B) mutant sed are shown. The amount of sed or msed mRNA was normalized to that of sodA mRNA as an internal control. Data labeled with different letters were significantly different from each other (P<0.05).

