
Figure 2.
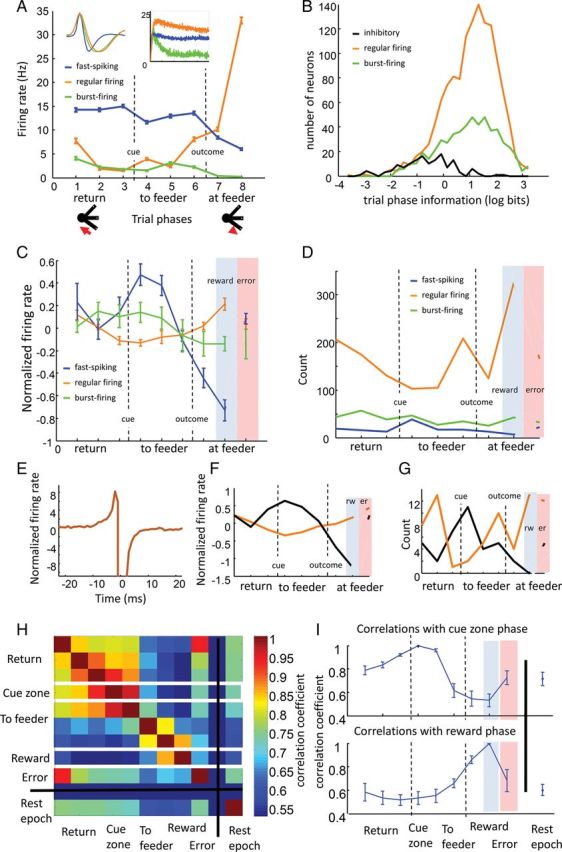
Different neuron classes exhibit different patterns of trial phase selectivity. (A) Activity across trial phases in an example fast-spiking inhibitory neuron (blue), regular-firing projection neuron (orange), and burst-firing projection neuron (green). All 3 neurons were simultaneously recorded on the same electrode. Firing rates are averaged across trials and displayed for each trial phase from the rat's departure from a feeder zone (phase 1) until obtaining subsequent reward again at a subsequent feeder zone (phase 8). Insets show average waveforms for each neuron (left) and 500-ms autocorrelograms (right). (B) Distribution of trial phase selectivity for inhibitory neurons and both regular-firing and burst-firing groups of excitatory neurons. Selectivity was measured in bits and log-normalized for illustration and statistical purposes. Both regular- and burst-firing projection neuron groups were much more selective for trial phase than interneurons. (C) Across-rat averages of relative trial phase activity for fast-spiking inhibitory and regular- and burst-firing projection neurons. Firing rates across trial phases were z-score normalized then averaged within rats for each cell type to show relative activity levels between trial phases (error bars are SEM across 5 rats). Fast-spiking neurons (blue) tended to fire when cues were presented, while regular-firing neurons (orange) tended to be least active during this time, and most active when rats acquired reward. (D) Similar patterns as in C can be observed by tabulating the number of neurons that fired maximally in each individual trial phase. (E) Mean, normalized cross-correlation of all 68 pairs of simultaneously recorded inhibitory and regular-firing projection with significant, reciprocal, inhibitory–excitatory interactions (only neurons with higher than 1-Hz firing rates included). (F) Trial phase activity among only those neurons within the 68 pairs (regular firing: orange, inhibitory: black). (G) Tabulated number of neurons with maximal firing in each individual trial phase. (H) A matrix of correlation coefficients, averaged across rats, between the firing rate vectors for each trial phase and for the rest epoch on the x and y axes. Firing rate vectors included all neurons recorded in a rat, where each element of the vector was the across-trial average firing rate of a neuron within the specific trial phase indicated. Hotter colors represent higher correlations. White lines around the fourth and eighth rows mark the correlation coefficients for cue and reward phases that are also presented in different graphic form in I. (I) Line graphs illustrate the same correlation coefficient data as presented in H for the cue (upper graph) and reward (lower graph) periods, with error bars representing SEM across 5 rats. The population activity was most distinct between cue and reward periods, and this was consistent across rats.