
Fig. 4.
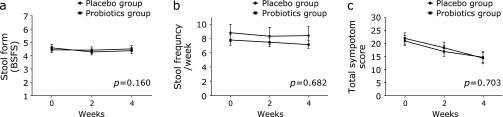
The change in stool form/frequency and total symptom score during the study period. (a) Stool form, (b) Stool frequency, (c) Total symptom score; Means and SE are shown. P values were calculated for time-group interactions by repeated-measures analysis of variance.