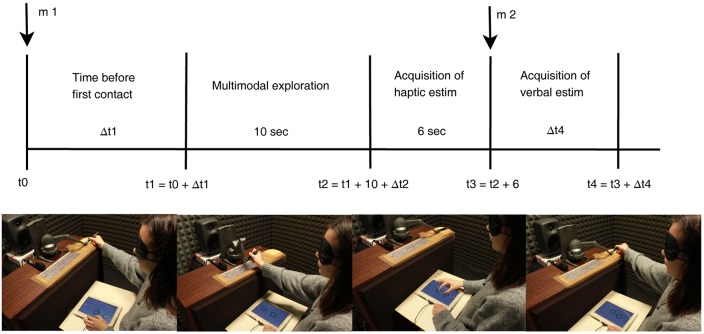
Figure 3.
Time-line of a single trial. Four pictures depict: begin of a trial, exploration phase, haptic estimation phase, and verbal estimation phase with return to starting position, respectively. At instants t0 and t3, two audio messages are played in Loudspeaker 2 signaling trial begin, m1, and the end of available time for haptic estimation, m2. Δt2 and Δt4 depict participant-dependent time interval.

