Figure 5.

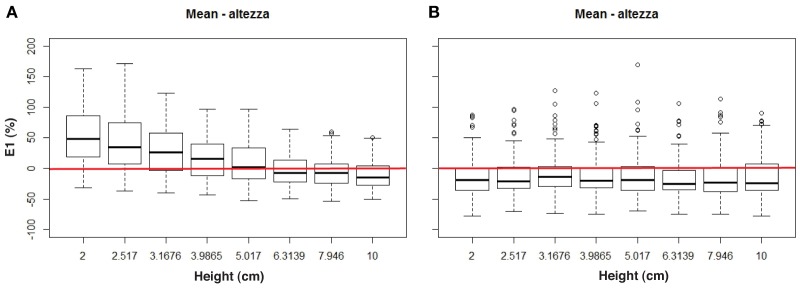
Mean haptic percentage error (A) and mean verbal percentage error (B) for each height, grouping all feedback conditions.

Mean haptic percentage error (A) and mean verbal percentage error (B) for each height, grouping all feedback conditions.