Figure 8.

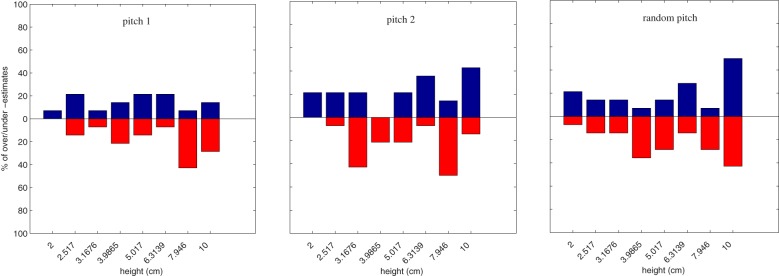
Percentage of over estimations (blue bars, 0–100% upward) and under estimations (red bars, 0–100% downward) over all non-musicians for each height. From left to right, pitch1, pitch2, and random pitch conditions.

Percentage of over estimations (blue bars, 0–100% upward) and under estimations (red bars, 0–100% downward) over all non-musicians for each height. From left to right, pitch1, pitch2, and random pitch conditions.