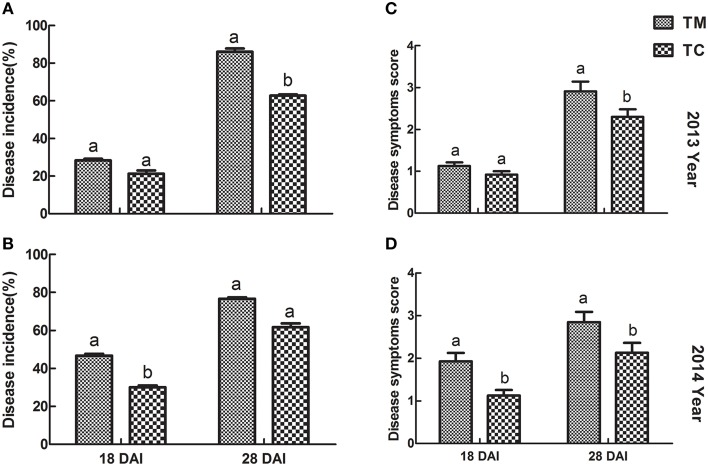
Figure 1.
Disease incidence and disease symptoms score of tomato inoculated with Vd1. (A,B) Disease incidence of tomato in 2013 and 2014, respectively. (C,D) Disease symptoms score in 2013 and 2014, respectively. 18 DAI and 28 DAT indicate 18 and 28 days after infected by Vd1, respectively. Data were the means of three replicates with standards errors shown by vertical bars. The different small letters above the bars represent the significance between two groups of mean values at a lever of p = 0.05 according to independent sample t-test.

