. 2015 Aug 14;4:e09590. doi: 10.7554/eLife.09590

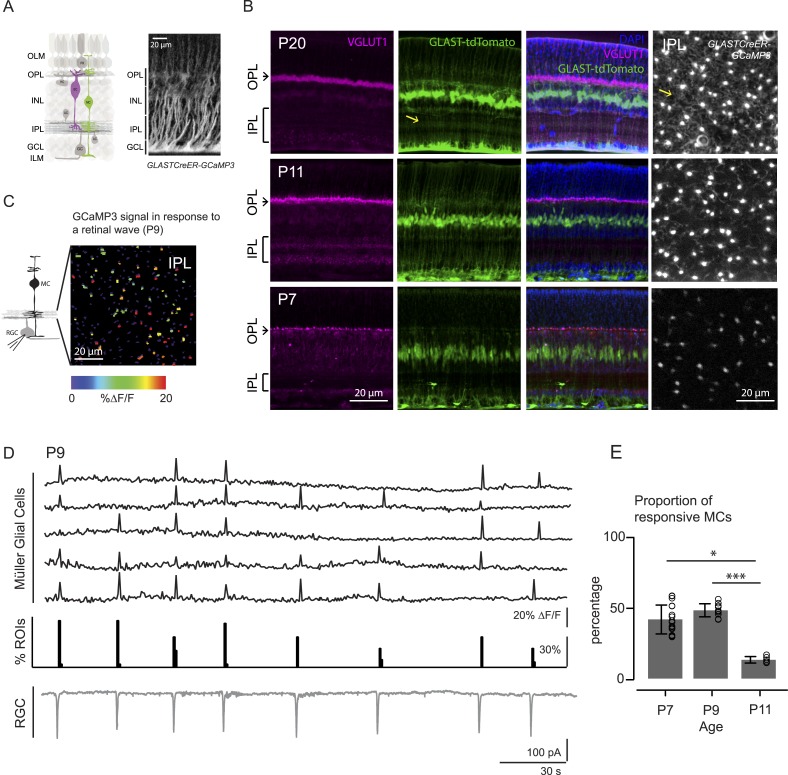
Figure 1. Morphology of Müller glial cells and their interactions with neurons change over development.

(A) Left, Diagram of adult retinal cross-section illustrates layered circuitry (OLM: outer limiting membrane; OPL: outer plexiform layer; INL: inner nuclear layer; IPL: inner plexiform layer; GCL: ganglion cell layer; ILM: inner limiting membrane) and main cell types (PR: photoreceptor; HC: horizontal cell; BC: bipolar cell; MC: Müller glial cell; AC: amacrine cell; GC: ganglion cell). Right, Orthogonal projection of two-photon Z-stacks shows GCaMP3 expression in MCs of a P22 GLASTCreER::GCaMP3 mouse retina. (B) Vibratome sections of GLASTCreER::tdTomato retinas show the structure of MCs (green; tdTomato) and the expression of vesicular glutamate transporter 1 (VGLUT1) in bipolar cells (magenta; anti-VGLUT1) at different ages. Blue stain is 4′,6-diamidino-2-phenylindoele (DAPI) for visualizing cell nuclei as landmarks. Rightmost images are XY planes of the IPLs in GLASTCreER::GCaMP3 retinas showing GCaMP3 signal at different ages. Note the expansion of MC lateral processes into the IPL with development. Yellow arrows indicate lateral processes of the Müller glial cells. (C) Left, Circuit diagram of the retina highlights cells recorded for figures C and D; labeling as in Figure 1A. Right, XY plane shows GCaMP3 signals of MCs in response to a retinal wave in a P9 GLASTCreER::GCaMP3 retina. Color scale indicates normalized changes in fluorescence during a retinal wave. (D) Simultaneous MC calcium imaging and retinal ganglion cell (RGC) whole-cell voltage-clamp recording (Vm = −60 mV) of a P9 GLASTCreER::GCaMP3 retina. Sample ∆F/F traces (black traces) from individual regions of interests (ROIs) (that include stalks and processes of the MC population) in response to neuronal waves recorded in a RGC (grey trace). Histogram in middle denotes percentage over time of ROIs with responsive MCs. (E) Percentage of ROIs with responsive MCs during at least one retinal wave at different ages. P7: 1326 ROIs from 11 retinas; P9: 3027 ROIs from 14 retinas; P11: 872 ROIs from 6 retinas. Kruskal–Wallis one-way ANOVA, Dunn's post-hoc test. ***p < 0.001 and *p < 0.05. See also Figure 1—figure supplement 1 and Video 1.

DOI: http://dx.doi.org/10.7554/eLife.09590.003

Figure 1.

Figure 1—figure supplement 1. Comparison of two-photon calcium imaging signals in stalks and lateral processes of MCs.

Figure 1—figure supplement 1.

MC calcium transients were not compartmentalized within lateral processes, but were equally present in both lateral processes and stalks within the IPL. (A) Vibratome sections of GLASTCreER::TdTomato retina show the widespread expression across the slice (left). Higher resolution image of boxed portion of retina (right). Blue labeling: DAPI stained nuclei. (B) XY plane of an IPL shows MCs expressing GCaMP3 in a P9 retina (top). ROI mask was generated as described in ‘Materials and methods’ for A (middle). Stalks (yellow) and lateral processes (red) could be distinguished among all ROIs (bottom). ROIs presenting a round-shaped area were defined as stalks; the rest were defined as lateral processes. Yellow and red rectangles distinguish stalks from lateral processes, respectively. (C) Simultaneous calcium imaging of MC stalks and lateral processes and whole-cell voltage-clamp recording of a RGC (grey trace, Vm = −60 mV) monitored in the same field of view in a P9 GLASTCreER::GCaMP3 retina. (D) Left, Comparison of averaged calcium signals (ΔF/F) from lateral processes, stalks and all ROIs (stalks + lateral processes) evoked by a neuronal wave indicated by the inward current (black trace, bottom). The vertical dashed line denotes the beginning of the neuronal wave. Right, Graph summarizes these averaged calcium signals (ΔF/F). Error bars are standard deviations. Stalks: 86 ROIs from 2 retinas; lateral processes: 94 ROIs from 2 retinas. (E) Graph summarizes percentage of ROIs with MC parts that respond to at least one retinal wave. Error bars are standard deviations. (F) Line scans across MCs show a GCaMP3 signal duration of ∼3–5 s. Our standard rate of acquisition is 0.74 or 1.7 Hz. Thus to determine if we were missing any shorter MC calcium transients and to compare the temporal resolution from our standard acquisition, we used line scans to image several MCs at 300 Hz and found that the duration of each calcium transient was still ∼3–5 s. Left; Fluorescent image at the level of the IPL with line scan location (magenta); X-time (t) plot below image shows 3 example ROIs drawn around MC stalks. Right; GCaMP3 fluorescent signals from these 3 ROIs. Line scan acquisition is ∼300 Hz. Calcium transients indicate a response to neuronal activity. Notably we did not observe any calcium transients with line scan that had durations shorter than our standard imaging rate.