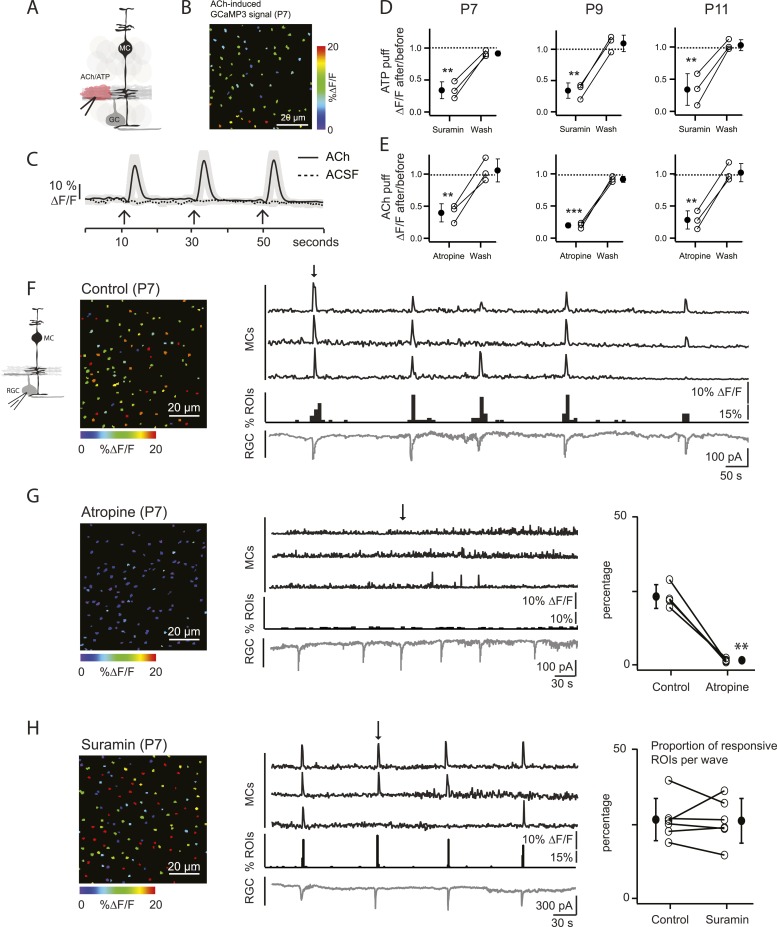
Figure 2. Volume release of acetylcholine (ACh) during P7 retinal waves induces calcium transients in MCs.
(A) Diagram of retinal cross-section illustrates focal application of the agonist (pink) at the junction between the IPL and the GCL; labeling as in Figure 1. (B) XY plane of the IPL from a P7 GLASTCreER::GCaMP3 retina showing fluorescent signals in MCs during a focal application of acetylcholine (ACh, 1 mM, 100 ms) pseudocolored as in Figure 1C. (C) Averaged MC calcium signals (ΔF/F) in a ROI evoked by a sequence of 3 focal applications of ACh (solid line; 78 ROIs from 1 retina) or artificial cerebrospinal fluid (ACSF, dashed line; 429 ROIs from 3 retinas). Black arrows indicate agonist application. Shaded areas represent standard deviation. (D) Averaged MC calcium signals (ΔF/F) evoked by focal application of ATP in the absence and presence of the non-specific P2 receptor blocker suramin (100 μM) at P7, P9 and P11. P7: 158 ROIs in control and 142 ROIs in suramin from 3 retinas; P9: 201 ROIs in control and 151 ROIs in suramin from 3 retinas; P11: 139 ROIs in control and 123 in suramin from 3 retinas. Black circle and error bars show mean ±SD. One-way ANOVA, Tukey post-hoc test ***p < 0.001; **p < 0.01. (E) Averaged MC calcium signals (ΔF/F) evoked by focal applications of ACh in the absence and presence of the muscarinic cholinergic receptor blocker atropine (50 μM) at P7, P9 and P11. P7: 256 ROIs in control and 396 ROIs in atropine from 3 retinas; P9: 234 ROIs in control and 264 ROIs in atropine from 3 retinas; P11: 183 ROIs in control and 121 ROIs in atropine from 3 retinas. One-way ANOVA, Tukey post-hoc test ***p < 0.001; **p < 0.01. (F–H) Simultaneous MC calcium imaging (black traces) and RGC whole-cell voltage-clamp recording (grey trace, Vm = −60 mV) monitored in the same field of view from a P7 GLASTCreER::GCaMP3 retina in control solution (F), in the presence of the muscarinic acetylcholine receptor blocker atropine (50 μM) (G), or in the presence of the non-selective P2 receptor antagonist suramin (100 μM) (H). Below the MC calcium transient traces are histograms showing the percentage of ROIs with responsive MCs over time. Left, Images show XY planes of the IPL with the MC fluorescent signals occurring at the time denoted by black arrows. Right, Plots summarize effects of suramin (350 ROIs in control and 390 ROIs in suramin from 6 retinas) and atropine (267 ROIs in control and 64 ROIs in atropine from 4 retinas) on the percentage of ROIs with responsive MCs per wave. Lines connect values from one experiment in control vs blocker. Black circle and error bars show mean ±SD. t-test **p < 0.01. See also Video 2.

