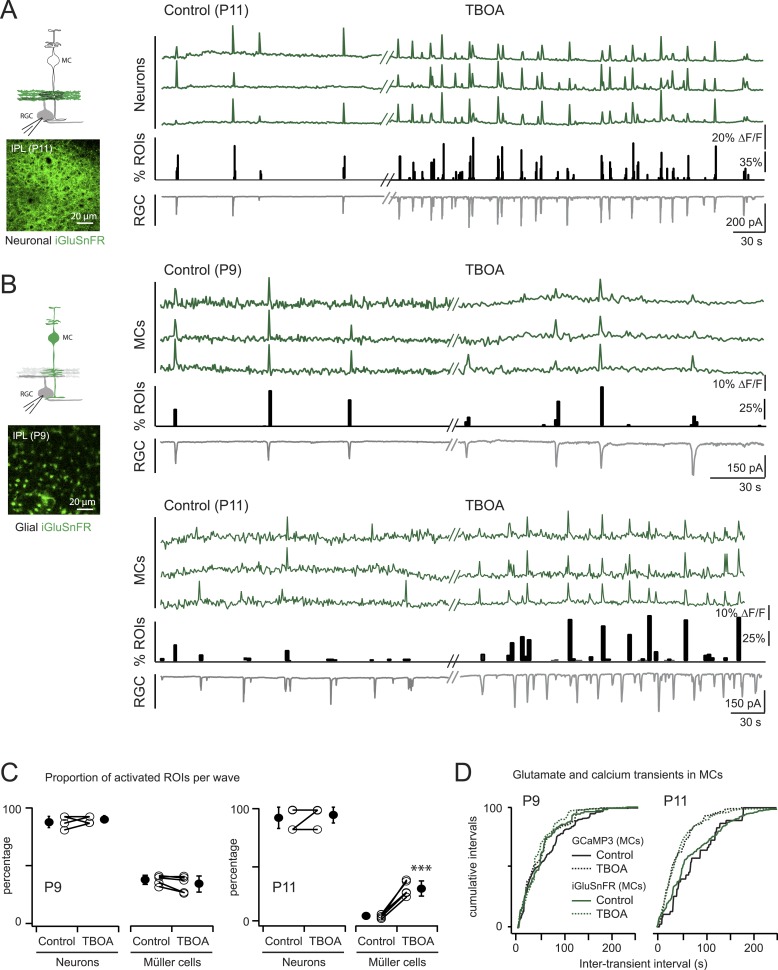
Figure 4. Glutamate released during neuronal waves reaches MC membrane at P9 but not at P11.
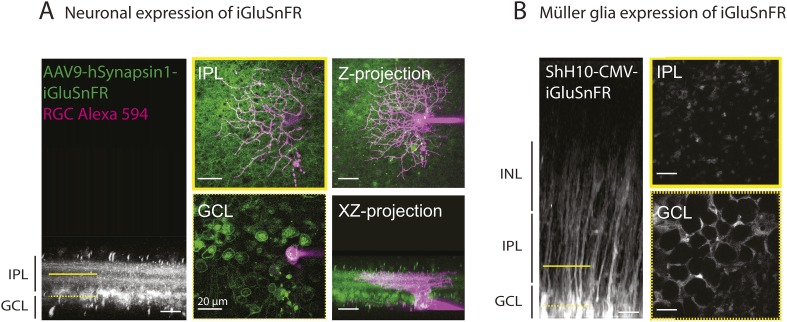
(A) Left, Diagram of a retinal cross-section illustrates neuronal expression of iGluSnFR (green) in the IPL and simultaneous voltage-clamp recording of a RGC (grey). XY plane of the IPL shows iGluSnFR expression in neuronal membranes at P11. Right, Simultaneous imaging of AAV9-2YF-hSynapsin-iGluSnFR signals in neuronal membranes (green traces) and whole-cell voltage-clamp recording of a RGC (grey trace, Vm = −60 mV) monitored in the same field of view at P11 in control and in the presence of 25 μM DL-TBOA. Above the whole-cell voltage-clamp trace are histograms showing the percentage of ROIs within a neuronal iGluSnFR signal. (B) Left, Diagram of a retinal cross-section illustrates glial expression of iGluSnFR (green) and simultaneous voltage-clamp recording of a RGC (grey). XY plane of the IPL shows iGluSnFR expression in MCs. Right, Simultaneous imaging of ShH10-CMV-iGluSnFR signals in MCs (green traces) and whole-cell voltage-clamp recording of a RGC (grey trace, Vm = −60 mV) monitored in the same field of view at P9 and P11 in control and in the presence of 25 μM DL-TBOA. Above each whole-cell voltage-clamp trace are histograms showing the percentage of ROIs with glial iGluSnFR signals in response to retinal waves. (C) Plot summarizes DL-TBOA effects on the participation of neuronal (160 ROIs from 5 retinas at P9 and 160 ROIs from 5 retinas at P11) and MC (1023 ROIs from 5 retinas at P9 and 1201 ROIs from 5 retinas at P11) ROIs per retinal wave. Lines connect values from one experiment in control vs DL-TBOA. Black circle and error bars are mean ±SD. t-test ***p < 0.001. (D) Cumulative probability distribution of inter-transient intervals of iGluSnFR (green traces) and GCaMP3 (black traces) signals in MC ROIs at P9 and P11. Control in solid lines and DL-TBOA in dashed lines. See also Figure 4—figure supplement 1 and Videos 4, 5.
DOI: http://dx.doi.org/10.7554/eLife.09590.010


