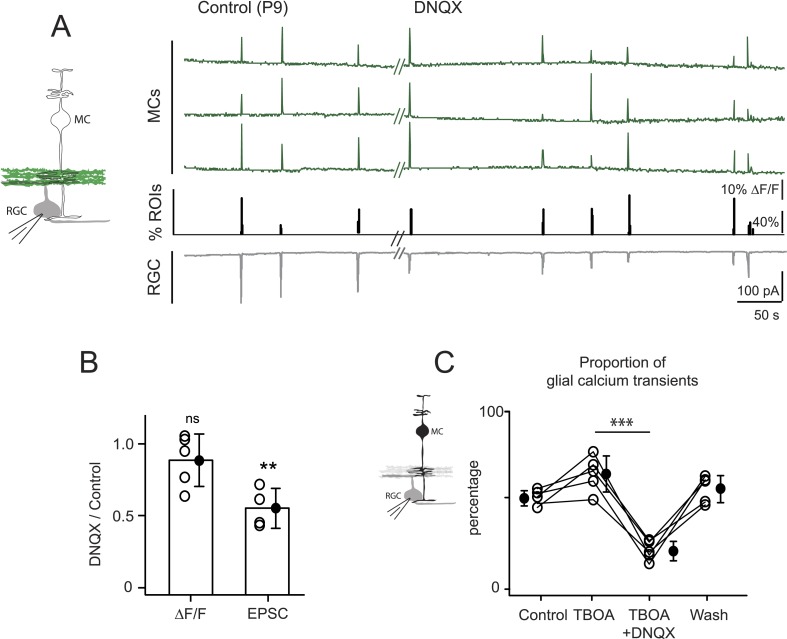
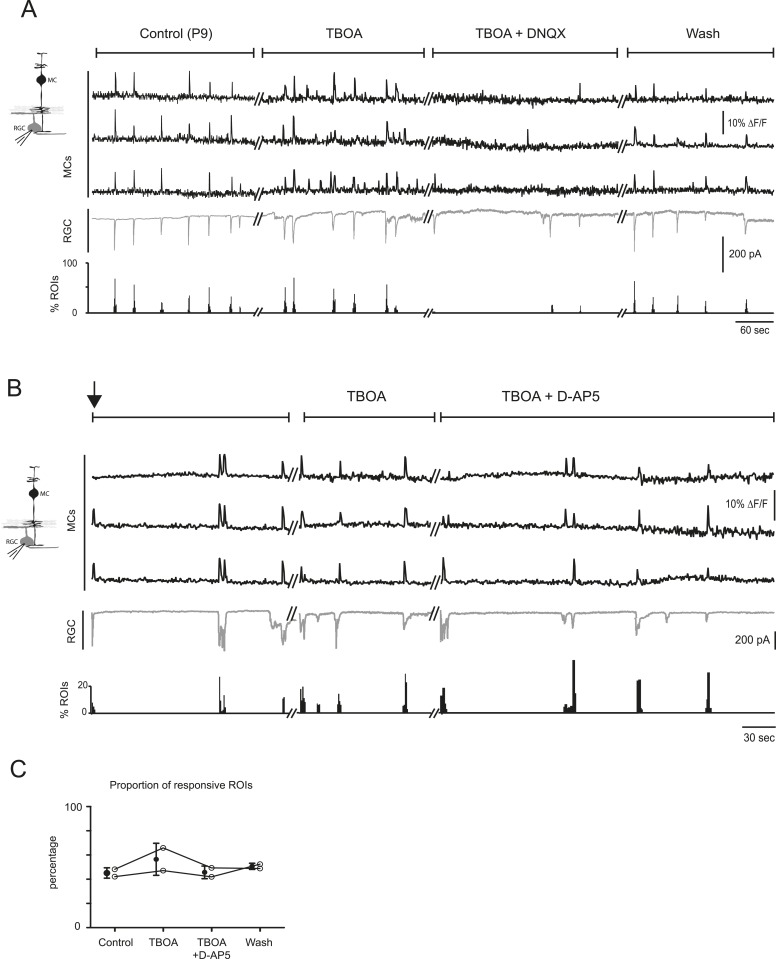
Figure 5. Neuron-glia interaction is mediated by ionotropic AMPA glutamate receptors.
(A) Left, Diagram of a retinal cross-section illustrates neuronal expression of iGluSnFR (green) in the IPL and simultaneous voltage-clamp recording of a RGC (grey). Right, Simultaneous imaging of AAV9-2YF-hSynapsin1-iGluSnFR signals in neuronal membranes (green traces) and whole-cell voltage-clamp recording of a RGC (grey trace, Vm = −60 mV) monitored in the same field of view at P9 in control and in the presence of 20 μM DNQX. Above each whole-cell voltage-clamp trace are histograms showing the percentage of ROIs with responsive neuronal iGluSnFR signals. (B) Graph summarizes the effect of DNQX on the change in volume release of glutamate (ΔF/F) and on the change in amplitude of the RGC excitatory postsynaptic currents. Each open circle plots the value from one experiment. Note, DNQX does not modify the amount of glutamate released from bipolar cells. Black circle and error bars are mean ±SD. t-test, **p < 0.01. (C) Left, Diagram of a retinal cross-section illustrates glial expression of GCaMP3 (black) and simultaneous voltage-clamp recording of a RGC (grey). Right, Graph summarizes the effect of DNQX on the percentage of ROIs with responsive glia at P9 in the presence of DL-TBOA (25 µM). Lines connect values from one experiment in control (974 ROIs), DL-TBOA (1154 ROIs), DL-TBOA+DNQX (397 ROIs) and wash (987 ROIs). Data collected from 5 retinas. Black circle and error bars are mean ±SD. One-way ANOVA, Tukey post-hoc test ***p < 0.001. See also Figure 5—figure supplement 1.


