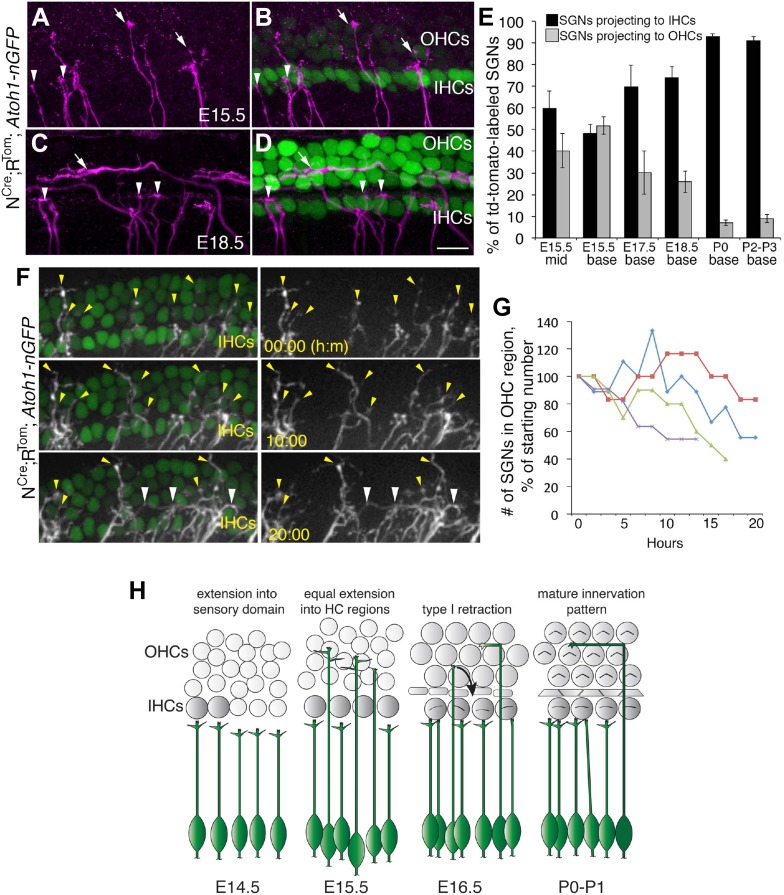
Figure 2. Sparse SGN labeling reveals retraction of processes from the OHC region during embryonic development.
(A–D) Fixed whole-mount cochleae from Neurog1CreERT2;R26RtdTomato; Atoh1nGFP mice at E15.5 (A, B) and E18.5 (C, D). Panels A and C show sparse-labeling of SGN fibers (tdTomato in magenta), while panels B and D show the same regions but include HCs in green. Note that at E15.5, the number of projections terminating in the IHC (arrowheads) and OHC (arrows) regions appears roughly equivalent. In contrast, at E18.5, the majority of SGNs terminate in the IHC region. (E) Comparison of the percentage of labeled SGNs that terminate in the IHC (black bars) or OHC region (gray bars) at different developmental time points (minimum of 6 cochleae per time point). Error bars are standard error of the mean (sem). (F) Sequential images at the indicated times from a single time-lapse experiment showing sparsely labeled SGNs with HCs (left) or alone (right) in an E16.5 cochlear explant. Yellow arrowheads indicate SGN fiber terminals in the OHC region. White arrowheads point to SGNs that are clustered around IHCs that had originally been in the OHC region. (G) Data from four imaging experiments illustrate a decrease in the number of fibers positioned in the OHC region over the course of experimental time. Since there was variability in the number of labeled SGNs between experiments, the data for each experiment were normalized to the number of labeled fibers present in the OHC region at time 0. (H) Illustration of the time-line of cochlear innervation. Fibers initially arrive at the IHC region around E14.5. At E15.5, when both IHCs and OHCs are present, SGN fiber distribution is roughly equal between the IHC and OHC regions. In contrast, by E16.5, many SGN fibers have withdrawn from the OHC region. At P0, the vast majority of SGNs terminate at the IHC region. These events occur before the final stages of synapse formation and subsequent fiber pruning. Scale bar in D: 15 μm, A–D; 20 μm, F.


