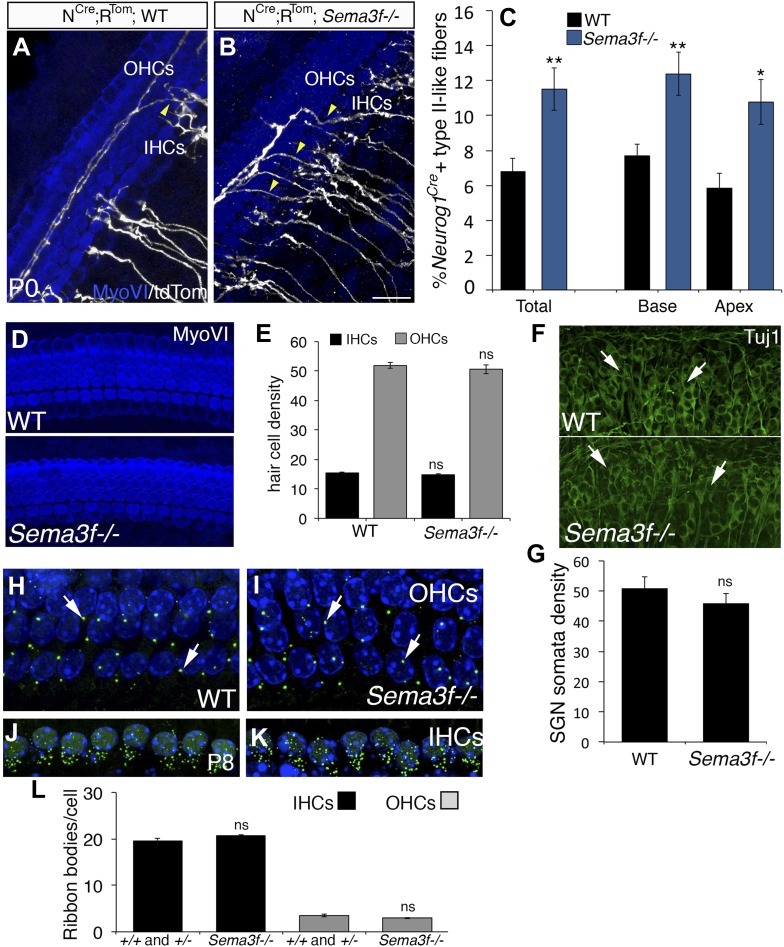
Figure 8. Deletion of Sema3f leads to increased SGNs in the OHC region.
(A, B) Representative images from Neurog1CreERT2;R26RtdTom; WT or Sema3f−/− cochleae at P0 stained with anti-myosin VI (HCs, blue) and tdTomato to mark individual SGNs (white). Increased numbers of crossing fibers (yellow arrowheads) projecting into the OHC region are present in the absence of Sema3f. IHCs, inner HCs; OHCs, outer HCs. (C) Absence of Sema3f leads to a significant increase in the percentage of labeled type II-like fibers (defined as SGNs that had crossed into the OHC region and turned toward the base). Note that the change in percentage in the absence of Sema3f is comparable to the change observed in Nrp2+/− heterozygotes (Figure 4E). **p ≤ 0.01; *p ≤ 0.05. n = 6 WT; 6 Sema3f−/−; error bars, sem. (D) Whole-mount images of HCs in WT and Sema3f−/− cochleae after myosin-VI immunostaining. (E) Quantification of number of IHCs and OHCs indicates no difference between WT and Sema3f−/−. n = 7 each genotype. (F) Whole-mount images of SGNs in WT and Sema3f−/− cochleae after Tuj1 immunostaining. The white arrows point to individually identifiable SGN somata. (G) Quantification indicates no difference in SGN density between WT and Sema3f−/−. n = 5 each genotype (H–K) Visualization of ribbon synapses (anti-Ribeye in green; white arrows) on IHCs and OHCs at P8. Nuclei are labeled with DAPI (blue). Overall, no differences in ribbon synapse numbers were observed between genotypes. (L) Quantification of ribbon bodies per IHCs and OHCs in P8. All differences were not significant (ns). Sample sizes: n = 6 for the control group, which is a combination of heterozygous and WT littermates; 4 Sema3f−/−. The scale bar in B = 15 μm for A and B; 30 μm, D; 40 μm, F and 12 μm, H–K.

