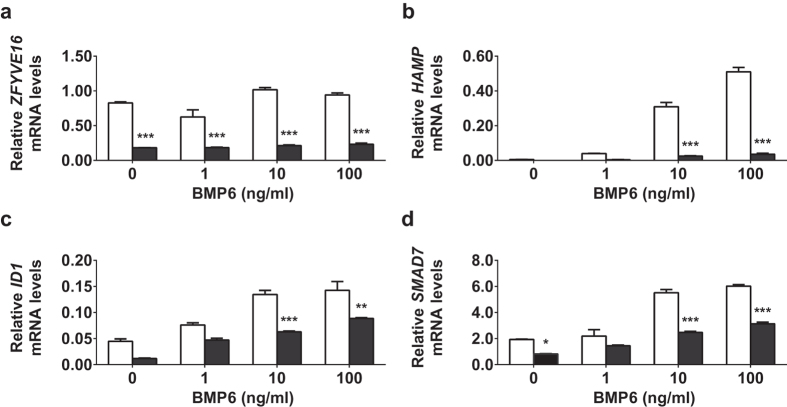
Figure 2. BMP-induced HAMP, ID1 and SMAD7 levels are decreased following endofin knockdown.
C3A cells were transfected with either non-specific siRNA (si-NS, white bars) or endofin siRNA (si-Endofin, black bars) for 72 hr and treated with BMP6 at 1, 10 or 100 ng/ml for 4 hr. The mRNA expression of (a) ZFYVE16 (Endofin), (b) HAMP, (c) ID1 and (d) SMAD7 were measured by qPCR and normalised to the geometric means of the reference genes ACTB and HPRT. Data are representative of three independent biological experiments. Bars represent means ± standard errors of triplicates. P-values were calculated using 2-way ANOVA; *indicates a p-value of < 0.05, **p < 0.01, ***p < 0.001.

