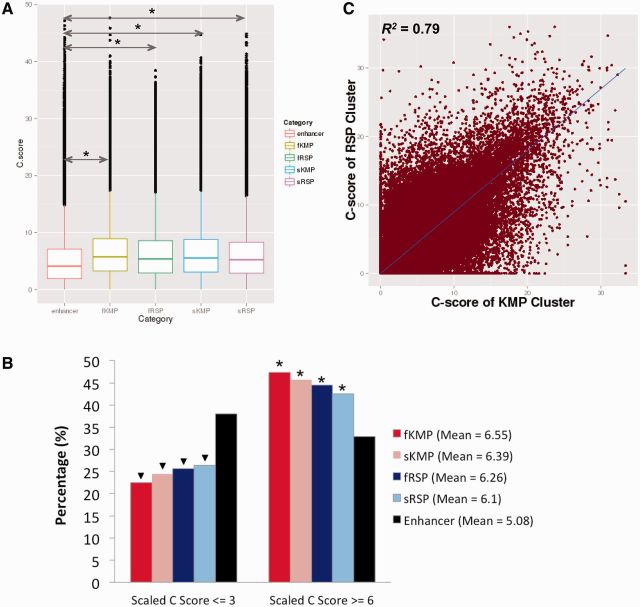
Fig. 4.
The CADD score of KMPs and RSPs is higher than those of enhancer positions. (A) Box plot of CADD scores of fKMP, sKMP, fRSP, sRSP, and enhancer positions, respectively. fKMPs are the most conserved category, followed by sKMPs, fRSPs, and sRSPs. The P-values were calculated using the Mann–Whitney test. (B) KMPs and RSPs are both enriched in the conserved category (scaled C-score ≥ 6), and depleted in the nonconserved category (scaled C-score ≤ 3). The mean values in the legend are the average scaled C-scores for the corresponding categories. Both P-values for enrichment and depletion were calculated using the Fisher’s exact test. An asterisk represents significant enrichment compared with control (enhancers), P < 2.23e-308. A triangle represents significant depletion compared with control (enhancer), P < 2.23e-308. (C) The average C-score of KMP clusters is positively correlated with the average C-score of the nearest RSP cluster. (R2 = 0.79; PCC = 0.89).

