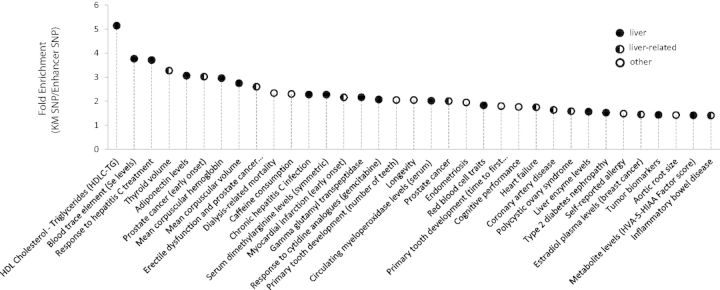
Fig. 6.

Enrichment of GWAS traits in KM SNPs relative to enhancer SNPs. The y axis is the ratio of fold enrichment of KM SNPs as compared with random expectation to the fold enrichment of enhancer SNPs as compared with random expectation. Only the top 35 enriched GWAS traits are presented here. Full results are presented in supplementary table S3, Supplementary Material online.
