Fig. 7.

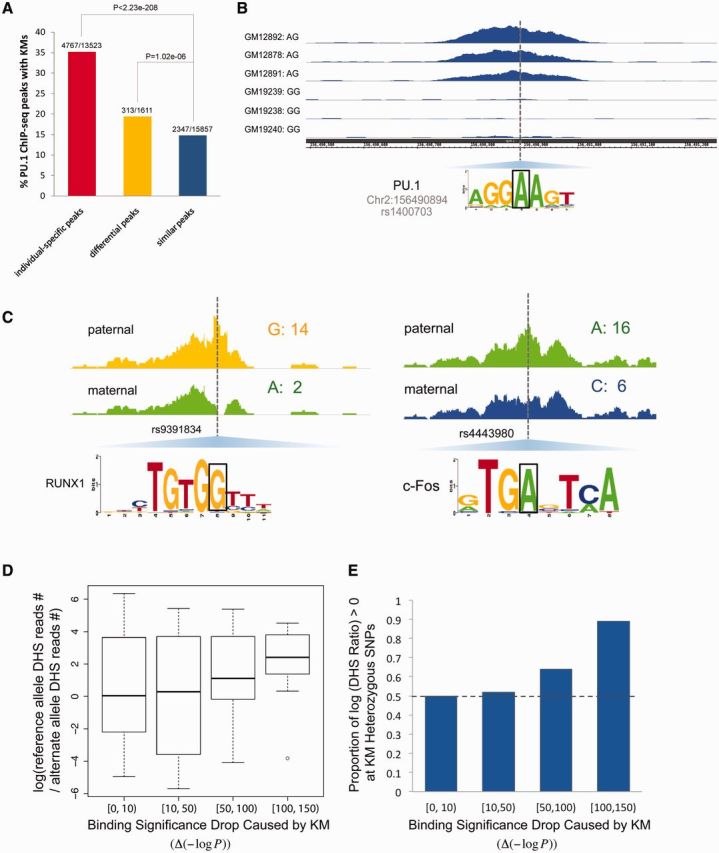
Candidate KMs affect TF binding and modulate local chromatin accessibility. (A) KMs/RSs are enriched in the differential and individual-specific ChIP-seq peaks of PU.1. P-values were calculated based on the Fisher’s exact test. The fraction above each bar indicates the percentage of peaks in the corresponding category containing KMs. The numerator is the number of peaks with KMs, the denominator is the number of peaks (B). One example showing that KM/RS is the causal variant that causes different PU.1 binding. The regions shown here are 1.2 kb long. (C) Examples of allele-specific DNase I sensitivity in GM12878 for KMs that disrupt TF binding (801-bp windows centered on a heterozygous KM SNP). In total, 299 heterozygous SNPs with at least 11 DNase-seq reads are KMs. The number after each nucleotide indicates the number of reads associated with that nucleotide. (D) Correlation between local accessibility and binding significance. The y axis is the log odds ratio of DNase I read coverage of the reference allele to that of the alternative KM allele. The x axis is the decrease in binding significance of the original reference allele caused by a KM allele. (E) Proportion of positive log odds ratio of DHS coverage (reference allele/KM allele) versus binding significance drop caused by a KM allele.
