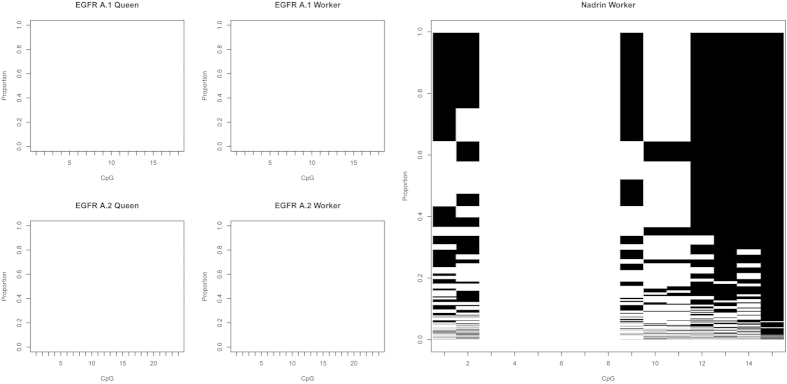
Figure 2. Methylation patterns in egfr and nadrin revealed by deep amplicon sequencing.

Each row represents a methylation pattern (black: methylated CpGs, white: not methylated CpGs), the height of each pattern is proportional to the pattern’s abundance. Two EGFR amplicons (A1 and A2) were amplified from 96 hrs old queen and worker larvae. One nadrin amplicon was amplified from 96 hrs worker larvae that have been shown in the Kamakura paper to have elevated methylation levels. After normalising pattern frequencies using MPFE21, no methylation was detected in egfr, whereas several distinct and highly abundant methylation patterns are detected in the nadrin amplicon. The pattern proportions are sorted from the most abundant at the top to the least abundant at the bottom.
