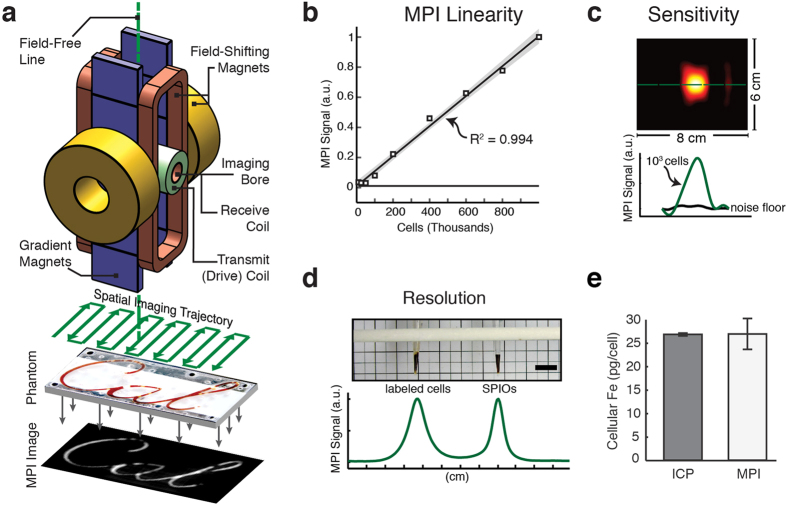
Figure 1. MPI is a tracer imaging modality that can image tagged cells using time varying magnetic fields.
(a) Diagram of a projection MPI scanner. Three superposed magnets (field-shifting magnets, gradient magnets, and transmit coil) produce and translate a magnetic field-free line (FFL) across an imaging volume. As the FFL is rastered across a distribution of superparamagnetic iron oxide (SPIO) particles using a spatial imaging trajectory, the particle ensemble magnetization changes in magnitude and orientation in response. The changing particle magnetization is detected via a detector coil and reconstructed to form an image. (b) Plot of MPI signal from 9 SPIO-labeled cell populations ranging from 1 × 10⁴ to 1 × 10⁶ cells, shown with MPI system noise floor. SPIO signal in MPI is linear with cell number (R2 = 0.994, linear fit and 95% confidence bounds for fitted slope shown). (c) Detection threshold for MPI cell tracking in FFL scanner. Approximately 1,000 SPIO-labeled hESC-derived cells in a 100 μL in vitro suspension were imaged using MPI and compared to an empty scan. The signal-noise ratio of the image is estimated at above 5, giving a detection limit of approximately 200 cells. This represents the current detection sensitivity limit of our FFL MPI scanner, but the theoretical detection limit may be as low as a single cell. FOV: 6 cm × 8 cm. 20 second MPI acquisition. (d) MPI 1D line profile of Resovist-labeled cells and Resovist point sources. The FWHM resolution of the MPI signal is approximately 1.5-fold better for Resovist SPIO particles alone, at 5 mm, than for SPIO particles transfected into cells, at 7.7 mm. Scale bar: 1 cm. (e) MPI estimates for average cellular iron content (27.0 ± 3.3 pg/cell) correspond with ICP analysis (26.8 ± 0.3 pg/cell), making MPI useful for nondestructive iron quantification. n = 3 for ICP and n = 4 for MPI; results are mean ± SD.

