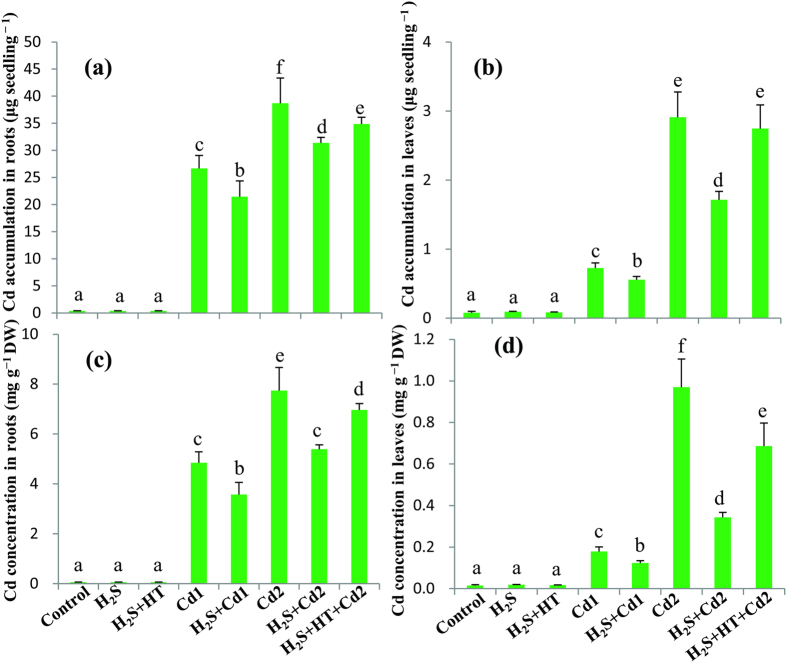
Figure 1. Effect of NaHS on Cd homeostasis in rice plants subjected to Cd stresses.
(a) Cd accumulation in roots, (b) Cd accumulation in leaves, (c) Cd content in roots and (d) Cd content in leaves. Control, H2S, H2S + HT, Cd1, H2S + Cd1, Cd2, H2S + Cd2, and H2S + HT + Cd2 correspond to the group of seedlings exposed to only nutrients, 100 μM NaHS, 100 μM NaHS + 200 μM hypotaurine, 250 μM CdCl2, 100 μM NaHS + 250 μM CdCl2, 500 μM CdCl2, 100 μM NaHS + 500 μM CdCl2 and 100 μM NaHS + 200 μM hypotaurine + 500 μM CdCl2, respectively. Bars represent standard deviation (SD) of the mean (n = 3). Different letters (a–f) indicate significant differences among the treatments at P < 0.05, according to Duncan’s multiple range test. DW, dry weight.

