Figure 1.
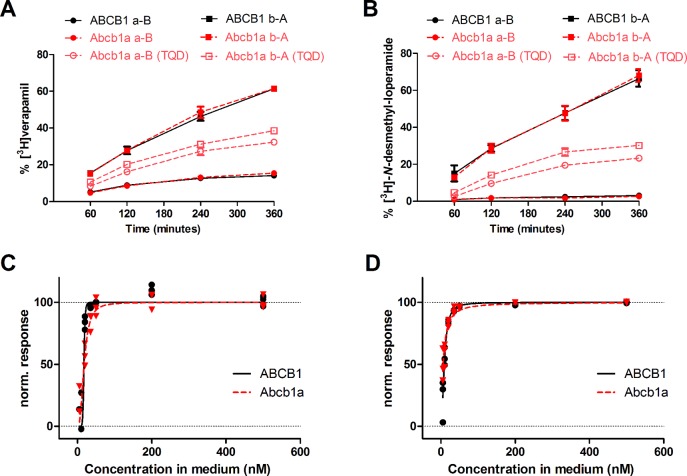
Bidirectional transport of [3H]verapamil (A) and [3H]-N-desmethyl-loperamide (B) by ABCB1- (black) and Abcb1a-transfected LLC cells (red) shown as % of initial concentration in the donor compartment over 360 min without tariquidar. For Abcb1a-transfected LLC cells, transport of [3H]verapamil and [3H]-N-desmethyl-loperamide is also shown in the presence of 500 nM tariquidar (TQD, open red symbols). All experiments were performed in triplicate, and values are shown as mean ± SD. The normalized response to ABCB1 inhibition of [3H]verapamil (C) and [3H]-N-desmethyl-loperamide (D) transport in ABCB1- (black) and Abcb1a-transfected cells (red) was calculated based on transport ratios (TR) over 6 h in bidirectional transport assays (see Experimental Section) and is plotted against tariquidar concentration (nM) in the assay medium. A sigmoidal Hill function was fitted to the data and gave for transport of [3H]verapamil an estimated half-maximum inhibitory concentration (IC50) of 17.2 nM (95% confidence interval CI: 6.7–44.3) and a Hill slope of 10.8 (95% CI: −56.3 to 77.8) for ABCB1-transfected cells, and an IC50 of 17.9 nM (95% CI: 14.1–22.6) and a Hill slope of 2.6 (95% CI: 1.1–4.2) for Abcb1a-transfected cells (C). For transport of [3H]-N-desmethyl-loperamide an IC50 of 9.0 nM (95% CI: 8.1–10.0) and a Hill slope of 2.1 (95% CI: 1.6–2.5) was estimated for ABCB1-transfected cells, and for Abcb1a-transfected cells an IC50 of 6.0 nM (95% CI: 4.9–7.3) and a Hill slope of 1.3 (95% CI: 0.9–1.6) (D). For definition of normalized response refer to the Experimental Section.

