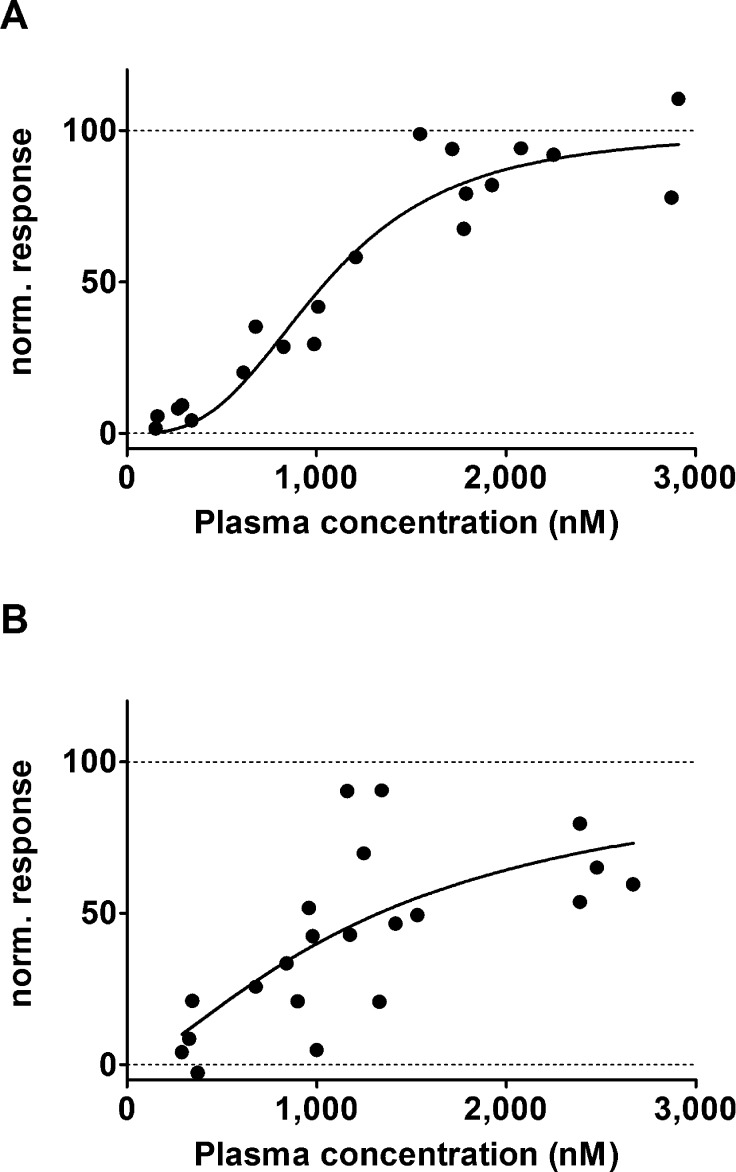
Figure 4.
Normalized response in terms of increase in brain-to-blood concentration ratio at the end of the PET scan (Kb,brain) for (R)-[11C]verapamil (A) and [11C]-N-desmethyl-loperamide (B) in C57BL/6N wild-type mice plotted against tariquidar plasma concentration (nM) measured at the end of the PET scan. For [11C]-N-desmethyl-loperamide, data after 30 mg/kg tariquidar were excluded. A sigmoidal Hill function was fitted to the data and gave an estimated half-maximum inhibitory concentration (IC50) of 1052 nM (95% confidence interval CI: 930–1189) and a Hill slope of 2.98 (95% CI: 2.00–3.95) for (R)-[11C]verapamil (A) and an IC50 of 1329 nM (95% CI: 980–1801) and a Hill slope of 1.44 (95% CI: 0.50–2.38) for [11C]-N-desmethyl-loperamide (B). Goodness of fit (R2) was 0.919 for (R)-[11C]verapamil and 0.508 for [11C]-N-desmethyl-loperamide. For definition of normalized response refer to the Experimental Section.

