
Figure 1. Phase quality (map CC) as functions of the numbers of the native and the derivative indexed patterns.
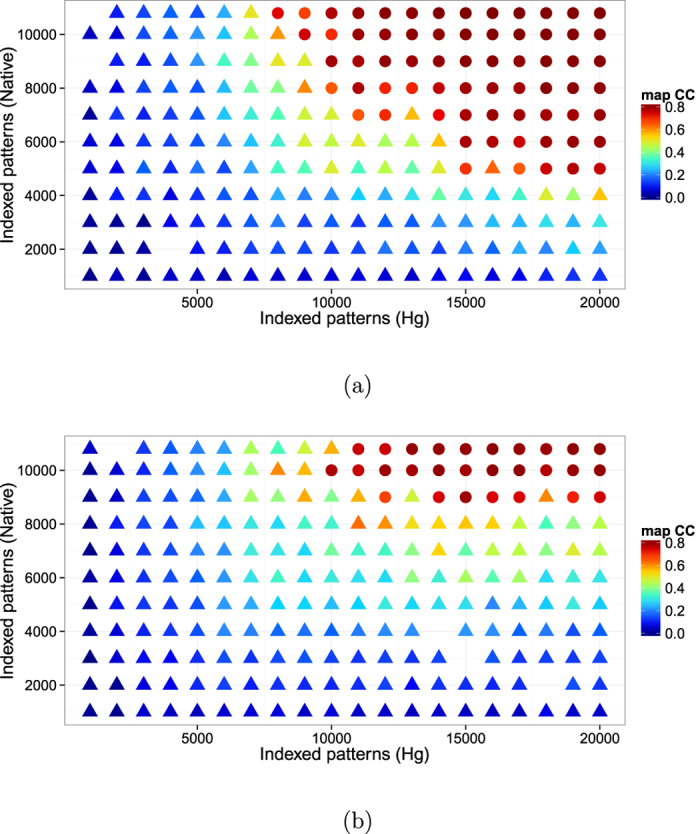
(a) SIRAS case. (b) SIR case. The success and failure of phasing are represented as circular and triangular symbols, respectively. The CC of electron density maps (defined in the main text) is indicated by colors. Some data points are missing because SHELXE failed to trace map. The figure was prepared using R36 with ggplot2 package37.