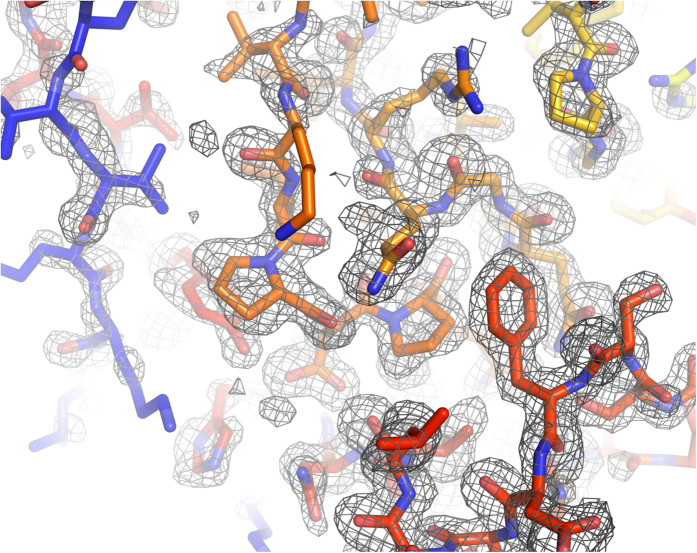
Figure 3. The SIRAS electron density map produced by SHELXE with a refined model of LRE.
10,000 and 10,792 patterns of derivative and native crystals were used for the calculation. The electron density map is contoured at 1.0σ. The figure was prepared using PyMOL39.

