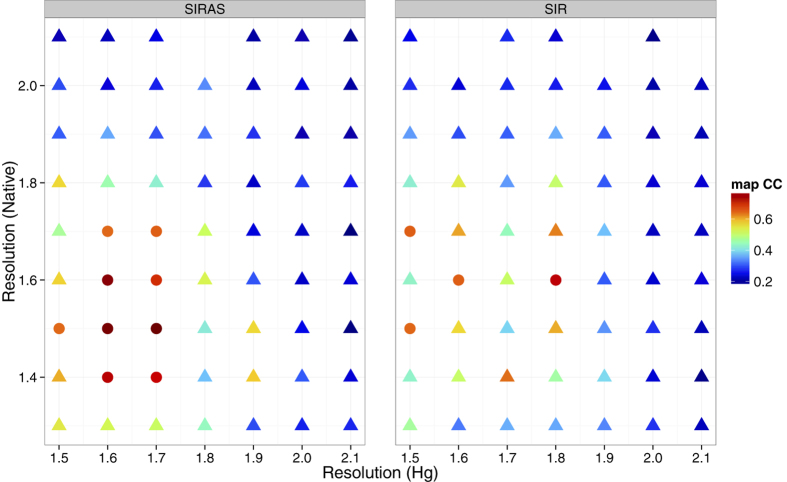
Figure 5. Effect of the high resolution cutoff on SIRAS/SIR phasing.
The indexed patterns of 10,792 native and 10,000 Hg derivative LRE crystals were used for this calculation. The color and symbol scheme are the same as in Fig. 1. It should be noted that the phasing was successful with lower resolution data when more patterns were used. The figure was prepared using R36 with ggplot2 package37.

