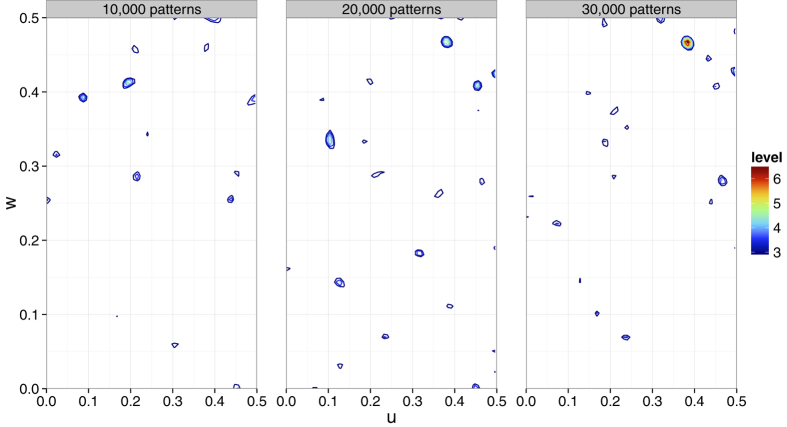
Figure 7. Anomalous difference Patterson maps.
The v = 1/2 Harker section is calculated using different numbers of indexed Hg derivative patterns. When 10,000 patterns are used, a peak of 3.2σ is observed at the Hg position. There are, however, other peaks higher than this in the Harker section. When 20,000 and 30,000 patterns are used, Hg peaks with heights of 5.0σ and 6.9σ, respectively, are observed and they are the highest peaks in the sections. The Patterson map was calculated using the CCTBX functionality38. The figure was prepared using R36 with ggplot2 package37.

