
Table 1. Data collection and refinement statistics.
| XFEL (SIRAS) |
SR (SAD) | ||
|---|---|---|---|
| Native | Hg-derivative | Hg-derivative | |
| Beamline | SACLA BL3 | SPring-8 BL26B2 | |
| Wavelength (Å) | 0.981 | 0.984 | 0.9839 |
| Beam energy* or photon flux | 30.0 μJ/pulse | 86.4 μJ/pulse | 2.0 × 10¹⁰ phs/s |
| X-ray detector | MPCCD (short working distance octal) | MX225 | |
| Space group | P212121 | P212121 | P212121 |
| Unit cell (a, b, c; Å) | 48.2, 77.6, 84.8 | 48.1, 77.5, 84.8 | 48.11, 77.18, 84.92 |
| Resolution range† (Å) | 10–1.50 (1.56–1.50) | 25–1.60 (1.66–1.60) | 40–1.70 (1.80–1.70) |
| Completeness† (%) | 100 (100) | 100 (100) | 99.8 (99.3) |
| SFX multiplicity† | 222.2 (196) | 106.2 (44) | n/a |
| Redundancy† | n/a | n/a | 3.9 (3.8) |
| No. crystals | 10,792 | 10,000 | 1 |
| Rsplit†,§ | 0.2727 (1.671) | 0.3727 (5.772) | n/a |
| Rmeas†,¶ | n/a | n/a | 0.101 (0.728) |
 †,‡ †,‡
|
2.56 (0.63) | 1.82 (0.19) | 10.58 (2.15) |
| CC1/2†,# | 0.893 (0.1988) | 0.835 (0.0279) | 0.997 (0.696) |
| CCano** | n/a | −0.066 | 0.16 |
| Refinement | |||
| Rwork, Rfree | 0.1845, 0.2318 | 0.2021, 0.2354 | 0.1444, 0.1776 |
| No. atoms (mean B-factor) | |||
| protein | 2,427 (27.0) | 2,403 (27.8) | 2,456 (22.6) |
| water | 188 (39.9) | 164 (35.6) | 158 (35.0) |
| ligand/ion | 9 (32.6) | 9 (30.6) | 9 (44.6) |
| Hg | n/a | 2 (25.6) | 3 (21.8) |
| r.m.s. deviation from ideal | |||
| bond lengths (Å) | 0.011 | 0.014 | 0.019 |
| bond angles (°) | 1.346 | 1.452 | 1.778 |
| Ramachandran plot | |||
| Favored (%) | 97.76 | 95.78 | 95.25 |
| Allowed (%) | 2.24 | 4.22 | 4.43 |
| Outlier (%) | 0 | 0 | 0.32 |
*XFEL beam energy calculated from the reflectivity or the transmittance of the components between the beam monitor and the sample position (attenuator, KB-mirrors, Be windows, and air path).
†Values in parenthesis are for the highest resolution shell.
‡Note that σ(I) estimation method is different between CrystFEL and XDS and they cannot be compared.
§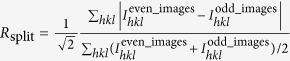 12.
12.
¶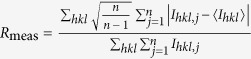 40.
40.
#CC1/2 is a correlation coefficient of intensities between randomly-halved datasets41.
**CCano is a correlation coefficient of anomalous intensity differences between randomly-halved datasets.