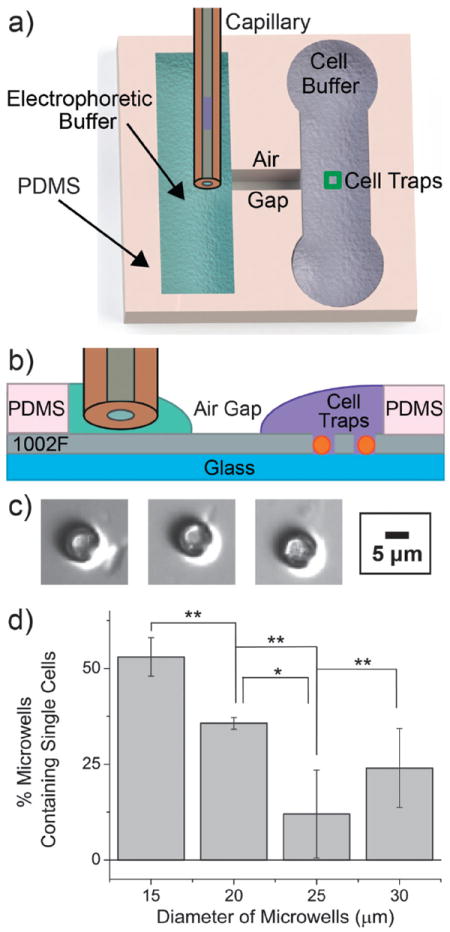
Fig. 1.

Optimization of the automated single-cell CE system for NK cells. (a) Schematic (top view) of the channel system used for automated singlecell CE analysis. (b) Schematic (cross section) through a section of the cell traps (not drawn to scale). Surface tension prevents the electrophoretic (green) and physiologic (purple) buffers from spilling into the air gap. The orange spheres represent cells within the traps. (c) Brightfield image of an NK cell trapped in each of three microwells. (d) The percentage of microwells entrapping a single cell is shown for microwells of varying diameter. Three replicates were obtained for each histogram (*p ≤ 0.05; **p ≤ 0.01).
