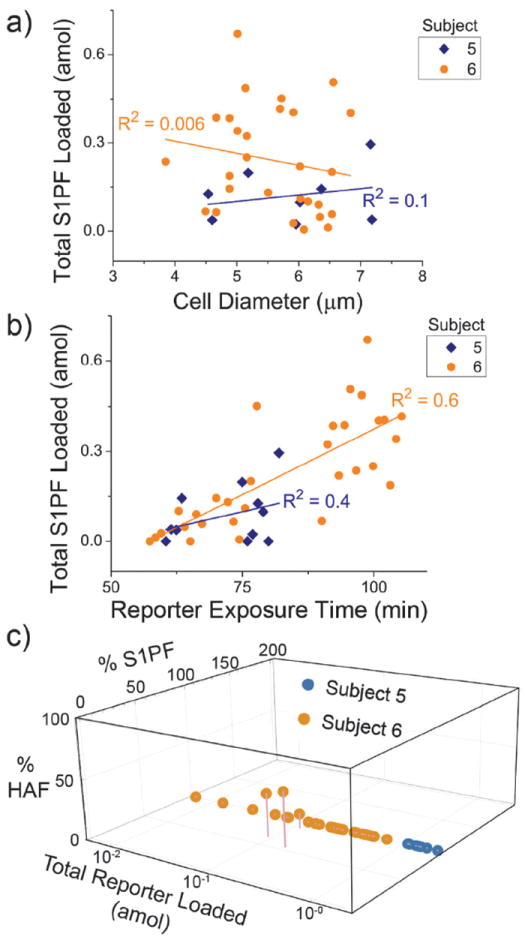
Fig. 4.

S1PF loading and metabolism in NK cells from two subjects (n = 36 cells). (a) The total amount of S1PF loaded into cells (S1PFmol + HAFmol) plotted against the diameter of the cells. (b) The total amount of S1PF loaded into cells (S1PFmol + HAFmol) was plotted against the reporter exposure time. (c) The percent of S1PF and HAF formed in a cell (relative to the total reporter loaded) was plotted against the total amount of S1PF reporter loaded into that cell.
