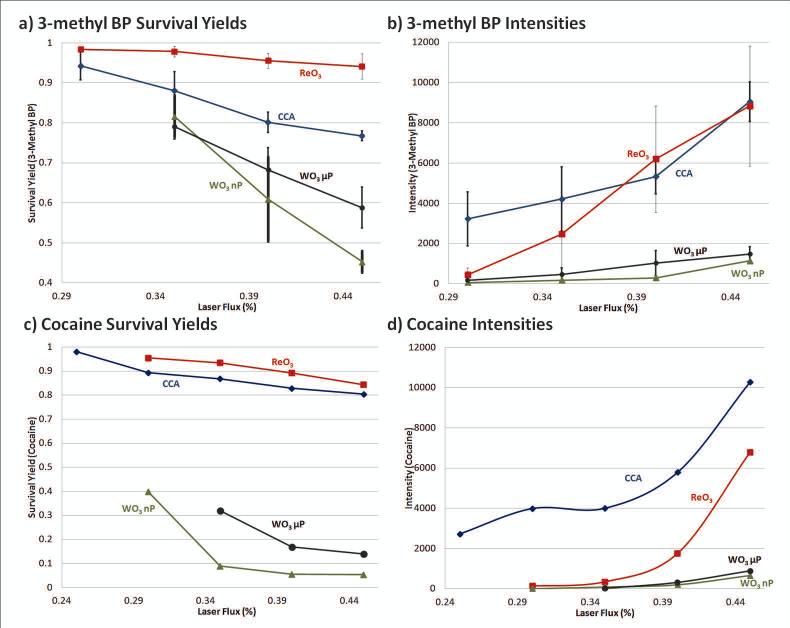
Figure 4.
Plots of survival yields versus laser flux percentage of a) 3-methyl BP ion at 50 ng/μL and for c) cocaine at 1 ng/μL for CCA matrix (blue diamonds), ReO3 μP (red squares), WO3 μP (black circles), and WO3 nP (green triangles). The overall intensity for 500 laser shots for b) 3-Methyl BP and d) cocaine are shown. In plots a) and b) error bars represent the standard deviation for an average of at least three runs taken at different days. 267×212mm (150 × 150 DPI)

