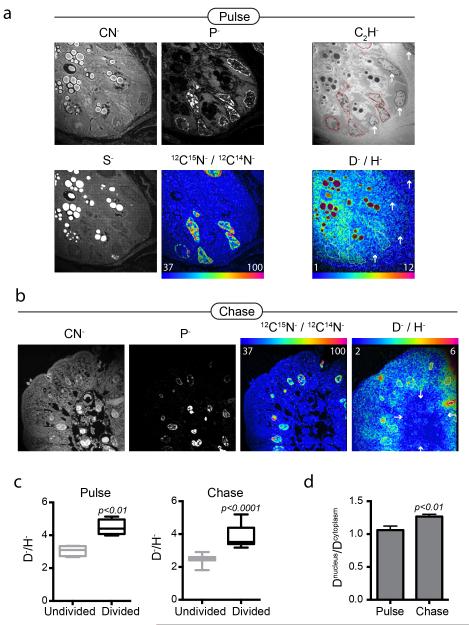
Figure 2. D-water labeling discriminates dividing cells in the mouse small intestine.
Mice pulsed for 3 days with D-water, while also receiving 15N-thymidine (20 μg/h). Samples of small intestine were harvested after 3-day pulse and again after 3-day label-free chase. (a) Small intestinal crypt. The field was first analyzed for masses CN, P, S, then masses C2H, D, and H. Nuclei are seen brightly in the P image. Sulfur rich granules in Paneth cells are seen brightly in the S image. The 12C15N:12C14N HSI image shows dividing crypt cells. The D:H HSI image shows higher D signal in the cells that have divided (15N+, nuclear ROI traced) compared to the undivided cells (arrows). Field = 28 × 28 μm, 85 planes; pixels = 256 × 256, 1.0 ms/pixel. (b) After 3-day chase, divided epithelial cells (15N+) at villus tip also show D label (nuclear ROI traced); whereas undivided (15N−) cells on the interior of the villus show low D labeling. Field = 28 × 28 μm, 77 planes; pixels = 256 × 256, 1.0 ms/pixel. (c) Graphs of nuclear D-signal in divided cells (15N+, n=7-12) versus undivided (15N−, n=4-11) cells. Box and whisker plot shows max/min. (d) Graph of the ratio of nuclear to cytoplasmic D-signal in divided cells (15N+, n=7-12). With chase, the ratio of nuclear to cytoplasmic D-signal increases, consistent with stability of genomic labeling and decay of signal in non-genomic material (e.g. protein). Data expressed as mean +/− S.E.M.

