
FIGURE 2.
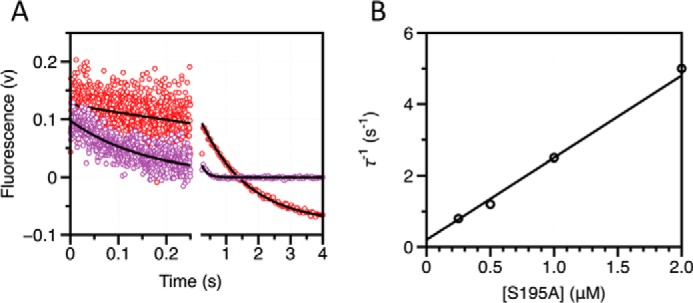
Kinetic traces of FPR binding to thrombin in the presence of excess enzyme. A, kinetic traces of a fixed concentration of FPR binding to excess thrombin in the free form shown on the time scales resolved experimentally. Concentrations of thrombin displayed are 0.25 μm (red) and 0.5 μm (purple). Black lines were drawn according to the single-exponential equation: a exp(−t/τ1) + b. B, plot of the relaxation derived from the single-exponential fit to the kinetic traces for FPR binding. Solid line was drawn according to the lock-and-key mechanism (Scheme 1) using best-fit parameters kon = 2.3 ± 0.2 μm−1 s−1 and koff = 0.2 ± 0.1 s−1, in good agreement with those derived from analysis of stopped-flow experiments with excess substrate (Table 1). Experimental conditions are: 50 mm Tris, 0.1% PEG8000, 400 mm ChCl, pH 8, at 15 °C.