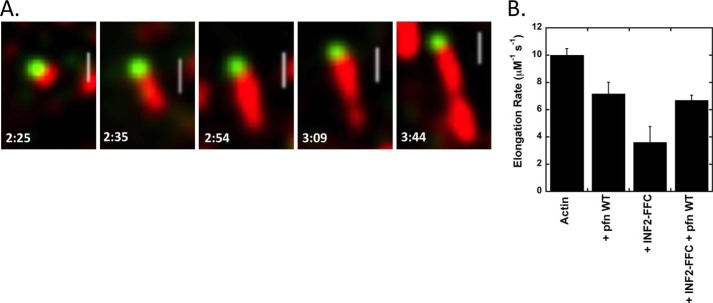
FIGURE 3.
TIRF elongation rates of INF2 FFC in the absence and presence of profilin. A, TIRF microscopy time lapse montage of elongating actin filament (red) with bound GFP-INF2-FFC (green) at barbed end. Reaction was initiated by mixing 1 μm actin (20% TAMRA-labeled) with 0.2 nm GFP-INF2-FFC. Under these conditions, INF2 is confined almost exclusively to the barbed end. Numbers indicate time (min:s). Scale bar, 2 μm. B, bar graph of elongation rates for each condition tested. For these measurements, the INF2-FFC is not coupled to GFP. Rates determined from at least six filaments, and error bars denote standard deviation. pfn, profilin.

