FIGURE 4.
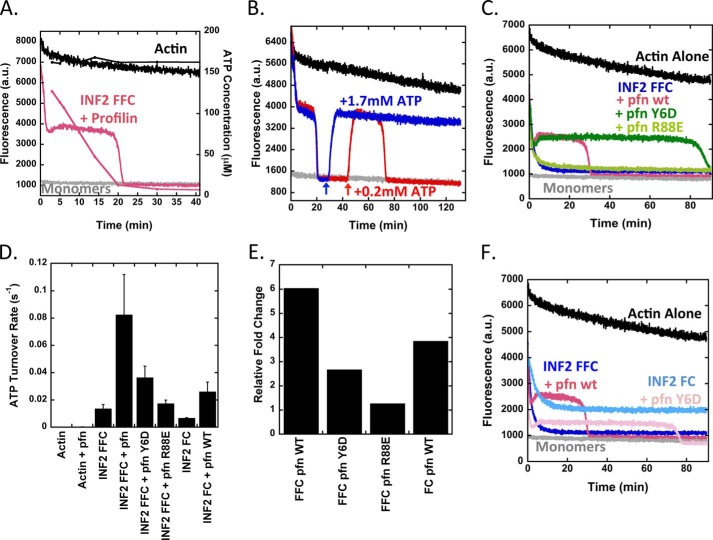
Profilin accelerates ATP turnover and shifts the equilibrium state for INF2/actin. A, pyrene-actin depolymerization curves overlaid with ATP concentration curve as in Fig. 1E, but with 10 μm profilin added. Actin, 5 μm (5% pyrene) prepolymerized overnight. INF2-FFC, 2 μm. B, effect of ATP readdition to polymerization equilibrium established by INF2-FFC and profilin. Reactions contain 5 μm prepolymerized actin (5% pyrene), 2 μm INF2-FFC, and 10 μm profilin. Additional ATP added at times indicated by arrows. In the red curve, 0.2 mm ATP was added. In the blue curve, 1.7 mm ATP was added. C, pyrene actin depolymerization assays containing 5 μm prepolymerized actin (5% pyrene), 2 μm INF2-FFC, and 10 μm of profilin or profilin mutants Y6D (poly proline-binding mutant) or R88E (actin-binding mutant). D, ATP turnover for reactions starting from 5 μm actin monomers alone or with combinations of 2 μm INF2-FFC, 2 μm INF2-FC, and 10 μm profilin or profilin mutants as indicated. Turnover determined based on four to six time points for each condition, bars represent standard deviation for three to eight separate experiments. E, fold change in ATP turnover for INF2-FFC or INF2-FC with or without profilin or profilin mutants. Determined from ATP turnover in Fig. 3D. F, pyrene-actin depolymerization assay containing 5 μm prepolymerized actin (5% pyrene) with 2 μm INF2-FFC or INF2-FC with or without 10 μm of profilin. pfn, profilin.

