FIGURE 5.
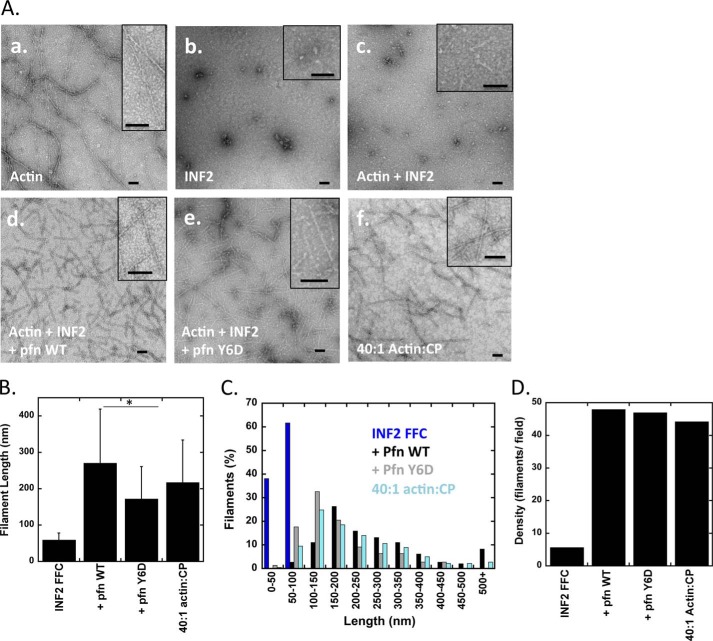
Evaluation of INF2 and profilin effects on actin filament length. A, negative-stain electron microscopy with 15,000× magnification. Actin monomers were incubated with INF2-FFC with or without profilin or profilin-Y6D in polymerization buffer for the indicated amounts of time (to attain steady state) before spotting on EM grid. Insets represent close-up of actin filaments. Scale bars, 100 nm. Panel a, 1 μm actin filaments polymerized for 10 min. Panel b, 1 μm INF2-FFC alone. Panel c, 2 μm actin filaments and 1 μm INF2-FFC incubated for 30 min. Panel d, 2 μm actin filaments, 1 μm INF2-FFC, and 4 μm profilin incubated for 15 min. Panel e, 2 μm actin filaments, 1 μm INF2-FFC, and 4 μm profilin-Y6D incubated for 15 min. Panel f, 2 μm actin polymerized in the presence of 50 nm capping protein. B, comparison of average filament lengths quantified from negative-stain EM images such as in A. Bars represent standard deviations. 34, 139, 139, and 170 filaments quantified for INF2-FFC alone, profilin, profilin-Y6D, and 40:1 actin:CP, respectively. The asterisk indicates Student's t test values of p < 1 × 10⁻⁵. C, histogram of filament length distributions from negative stain EM in A. D, density of actin filaments per visualization field from conditions in A.

