FIGURE 6.
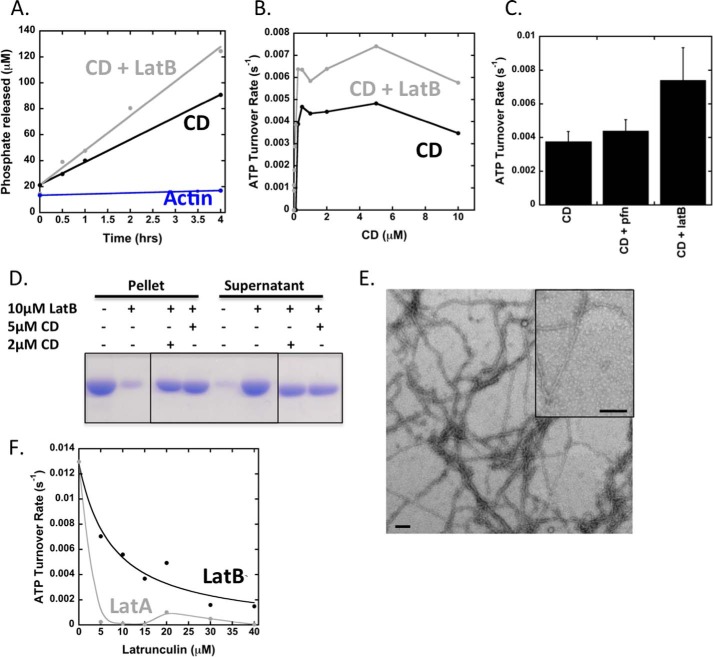
Effect of cytochalasin D on ATP turnover by actin. A, time course of ATP turnover for 5 μm actin alone or 5 μm actin + 5 μm CD in the presence or absence of 10 μm LatB. B, concentration curve of ATP turnover for reactions starting with 5 μm actin monomers in the presence or absence of 10 μm LatB and varying concentrations of CD. C, ATP turnover quantified from reactions starting with 5 μm actin monomers and 2 μm CD in the presence or absence of 10 μm LatB or 10 μm profilin. Error bars represent standard deviation for three or four separate experiments. D, high speed sedimentation assay starting with 5 μm actin monomers with indicated concentrations of CD and LatB. Samples were incubated for 20 min at 23 °C before centrifugation. Pellets and supernatants are shown. E, negative-stain EM of sample with 2 μm actin, 1 μm CD, and 4 μm LatB and incubated for 1 h. Insets represent close-up of actin filaments. Scale bars, 100 nm. F, ATP turnover for reactions starting with 5 μm actin monomers and 2 μm INF2 FFC either alone or with indicated concentrations of LatB or LatA.

