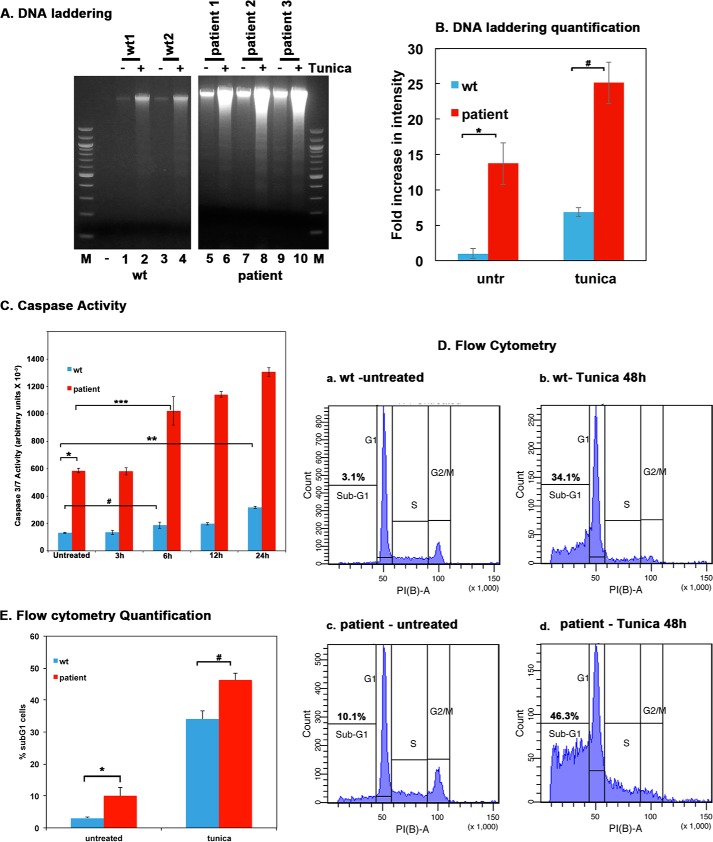
FIGURE 4.
Tunicamycin-induced apoptosis is enhanced in dystonia patient lymphoblasts. A, DNA fragmentation analysis. Lymphoblast cell lines established from 2 normal (WT) individuals and 3 dystonia patients were treated with 0.5 μg/ml tunicamycin for 48 h. The DNA fragmentation was analyzed as described under “Experimental Procedures.” Lanes 1–4: WT (normal) lymphoblasts; lanes 5–10, dystonia patient (affected) lymphoblasts. − lanes (1, 3, 5, 7, and 9), untreated cells; + lanes, (lanes 2, 4, 6, 8, and 10), tunicamycin-treated cells. Lane M, 100-bp ladder. B, quantification of DNA fragmentation. The inverted images from all four experiments as in panel A were analyzed by GE Healthcare ImageQuant TL software to calculate total band intensities in each lane from top to bottom. Blue bars, normal (WT) lymphoblasts; red bars, dystonia patient lymphoblasts. Band intensities in WT untreated samples were considered as 1.0, and all other samples were expressed as -fold increases compared with that value. Student's t tests were performed, and p values are as follows. * = 0.00012 (significant), # = 0.00015 (significant), n = 4. C, Caspase-Glo 3/7 assay. Lymphoblast cell lines established from 2 normal (WT) individuals and 3 dystonia patients were treated with 0.5 μg/ml tunicamycin for the indicated time points. Caspase 3 and 7 activities were measured. Blue bars, normal (WT) lymphoblasts; red bars, dystonia patient lymphoblasts. Student's t tests were performed, and p values are as follows. * = 0.00016 (significant), ** = 0.00041 (significant), # = 0.002 (significant), and *** = 0.0037 (significant), n = 4. D, flow cytometry analysis. Lymphoblast from 2 normal (WT) or 3 affected (dystonia patient) individuals were treated with 0.5 μg/ml tunicamycin. Cells were harvested at 48 h after the treatment and subjected to flow cytometry analysis. The sub-G0/G1 cell population represents the dying cells. The sub-G0/G1 percentages are displayed in each panel. These experiments were repeated four times. The most representative profiles from a single experiment with one WT and one patient line are shown. E, flow cytometry quantification and statistical analysis. The percentage of sub-G1 cells from the experiment in panel D is represented as a bar graph, and the percentages of sub-G1 cells from four different experiments were subjected to Student's t tests. p values are as follows. * = 0.00022 (significant), # = 0.00025 (significant).

