
FIGURE 6.
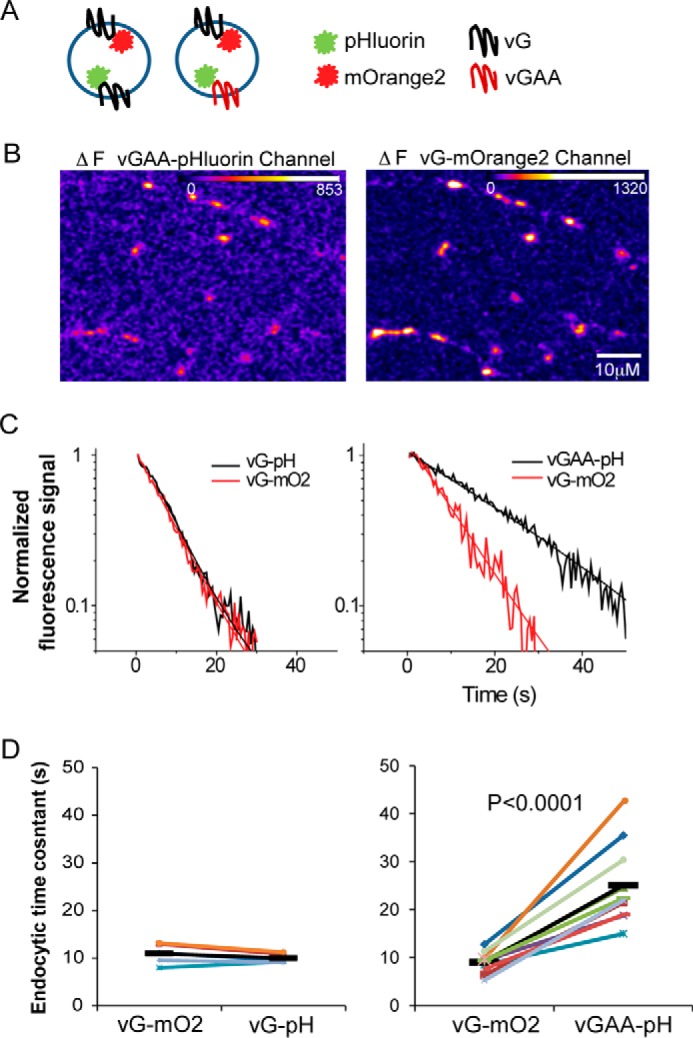
Slow and fast (WT) vGlut1 internalize with different kinetics even in the same synapses. A, graphic illustrates the experimental design to examine endocytosis kinetics of two different tagged cargos simultaneously. B, difference images of the exocytic response (10 Hz, 10 s) of vG-mOrange2 and vGAA-pHluorin during simultaneous acquisition from a representative neuron expressing both proteins. C, representative endocytosis kinetics and their single exponential fits for vG-mO2 and vGAA-pH following 10-Hz, 10-s stimulus. D, summary of paired comparison (paired Student's t test) of endocytic time constants for each neuron measured in different channels.