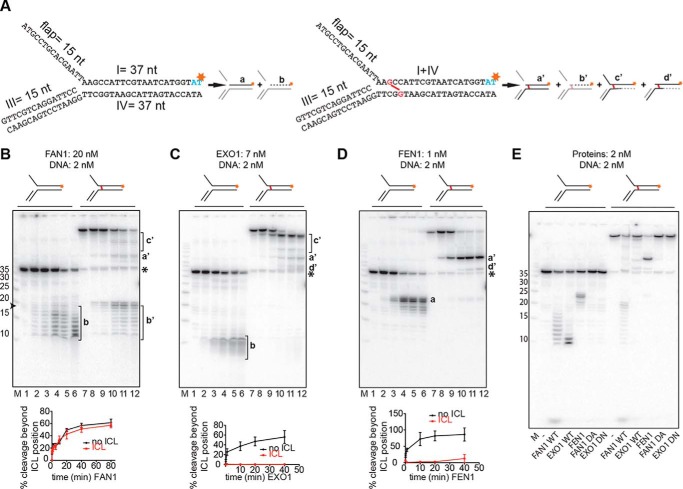
FIGURE 2.
Comparison of 5′ to 3′ exonuclease activities and the specificities of FAN1, EXO1, and FEN1. A, schematic of the DNA substrates used in this study. The unmodified flap substrates (left panel) and the substrates with a nitrogen mustard-like interstrand cross-link (right panel, cross-link shown in red) were produced as described under “Experimental Procedures.” Schematics of products generated by the above enzymes are shown next to the corresponding substrates. Red asterisks indicate the positions of the 32P-labeled nucleotides. Fragments invisible on the autoradiograph are shown in gray. B–D, incubation of the indicated substrates with FAN1 (B), EXO1 (C), or FEN1 (D). Aliquots were withdrawn after 0, 10 s, 2 min, 20 min, 40 min, and 80 min (B, lanes 1–6 and 7–12, respectively) or 0, 10 s, 1 min, 20 min, and 40 min (C and D, lanes 1–6 and 7–12, respectively). Lowercase letters on the right correspond to the products in A. The protein-to-DNA ratios were FAN1 (10:1), EXO1 (3.5:1), and FEN1 (1:2). M, low molecular weight marker (Affymetrix). The oligonucleotide sizes are indicated on the left. The black asterisk indicates the position of the non-cross-linked 37-mer oligonucleotide that was present in small amounts in the ICL substrate. The graphs below the autoradiographs of 20% denaturing polyacrylamide gels show the quantification of bands a or b, respectively. b' was generated by incisions in the top strand. Error bars show mean ± S.D. (n = 3). E, comparative analysis of cleavage products generated on the 3′ side of the cross-link by the three nucleases as well as by the nuclease-dead mutants of FAN1 (D960A) and EXO1 (D173N). The reaction conditions were as in Fig. 1E.

