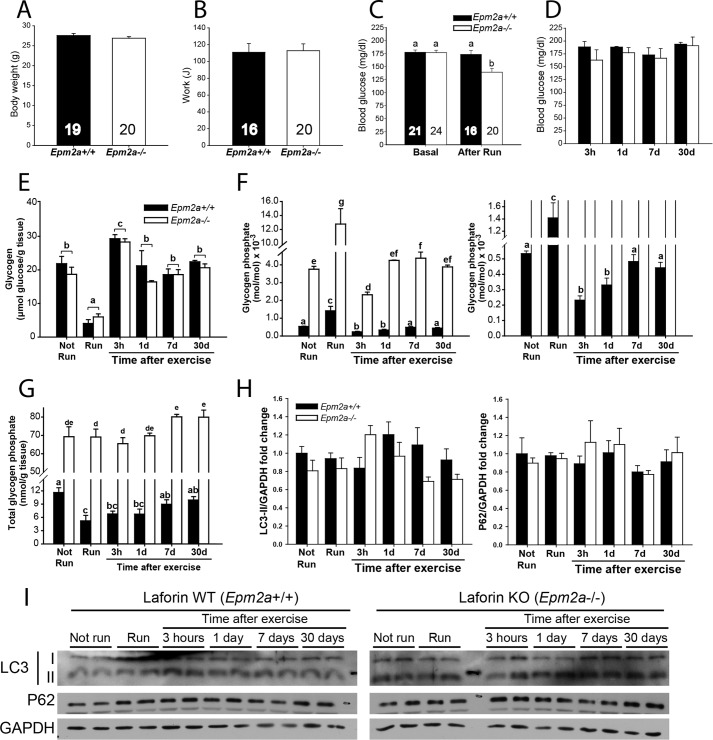
FIGURE 6.
Glycogen in exercised Epm2a+/+ and Epm2a−/− mice. Laforin knock-out mice (Epm2a−/−, filled bars) and genetically matched wild type mice (Epm2a+/+, open bars) were exercised to exhaustion and monitored up to 30 days post-exercise. A, total body weight (before exercise). B, exercise performance expressed as work (Joules). C, blood glucose before and immediately after exercise. D, blood glucose at the indicated time after exercise. The numbers in the bars indicate the n values for the given groups. E, total glycogen expressed as micromole of glucose/g of tissue. F, left, phosphorylation state of glycogen, expressed as mole of phosphate/mol of glucose × 10−3; right, expanded ordinate to allow better visualization of WT values. G, total glycogen phosphate content expressed as mole of phosphate/g of tissue. H, LC3-II and P62. Quantitation Western blot analyses of Epm2a−/− (filled bars) and genetically matched wild type mice Epm2a+/+ (open bars) for LC3-II and P62 normalized by GAPDH. No statistical differences were found in any condition or between genotypes. I, representative blots of 2 samples per condition of autophagy markers LC3 and P62 with GAPDH as loading control. Number of mice per group, n = 3–5, unless otherwise indicated (see also Table 2); for panels A–C, values from different groups were pooled as appropriate. Body weight and work were compared using a t test, whereas other parameters were compared using a multiple-way analysis of variance. Data are mean ± S.E. Bars with the same letter are not significantly different from each other; different letters indicate p < 0.05. Total glycogen was not different between genotypes.

