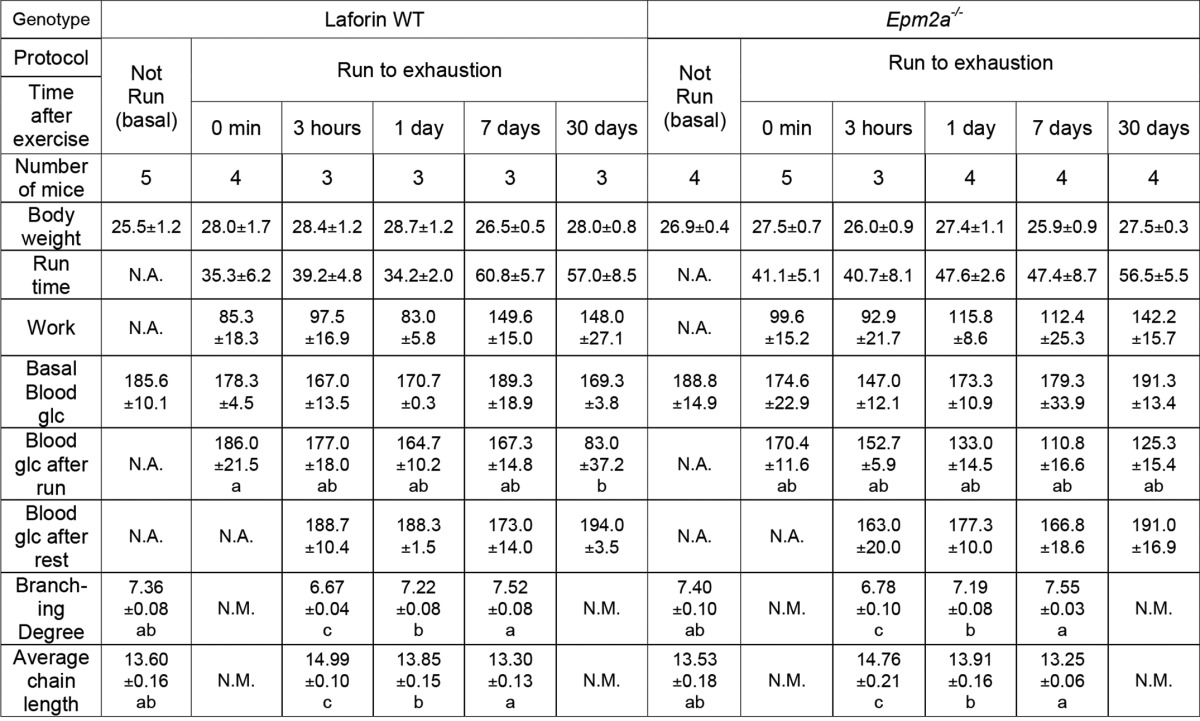
TABLE 2.
Body weight, exercise performance, blood glucose, and glycogen branching of Laforin WT and Epm2a−/− mice
Weight is expressed as grams. Run time is expressed as minutes until reaching exhaustion. Work is expressed as Joules. Blood glucose (Glc) is expressed as (mg/dl). N.A., not applicable. N.M., not measured. Data are mean ± SE. No differences among groups in body weight, run time, work based on analysis of variance. To compare blood glucose analysis of covariance was used. No difference was observed between genotypes in degree of branching and average chain length. Values with the same letter are not different (p < 0.05).