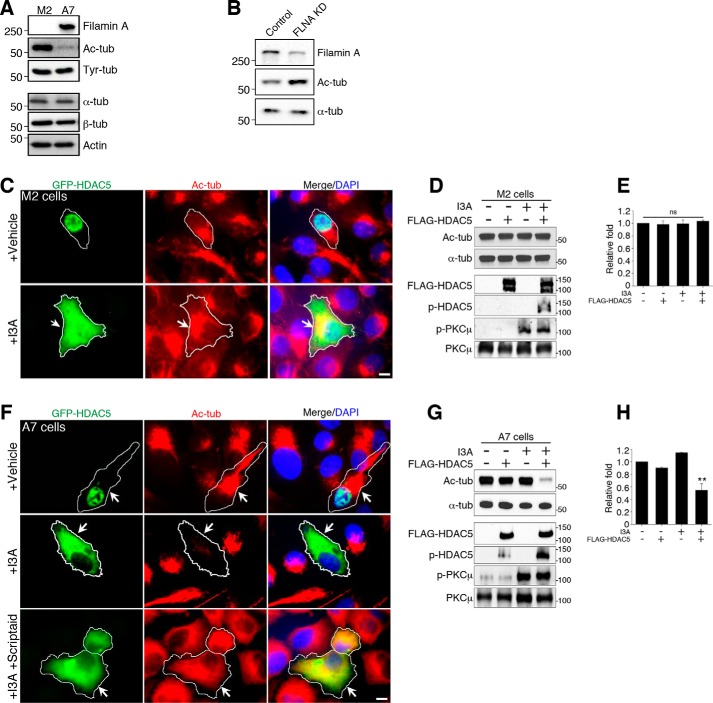
FIGURE 2.
Filamin A is required for HDAC5-mediated tubulin deacetylation. A, cell lysates from filamin A-deficient human melanoma cells (M2) and filamin A-recovered M2 cells (A7) were analyzed for tubulin acetylation by Western blot. The levels of acetylated α-tubulin (Ac-tub) were drastically higher in M2 cells compared with A7 cells, whereas the levels of tyrosinated α-tubulin (Tyr-tub), total α- or β-tubulin, and actin were similar in both cell lines. B, cultured DRG neurons were infected with control shRNA lentivirus or FLNA KD lentivirus and analyzed by Western blot. Filamin A knockdown increased the level of acetylated tubulin in DRG neurons. C, M2 cells expressing GFP-HDAC5 were treated with the PKC activator I3A or left untreated, and the cellular localization of HDAC5 and the level of Ac-tub in the cells was analyzed by immunocytochemistry. I3A-induced cytoplasmic localization of GFP-HDAC5 did not alter Ac-tub levels. Scale bar = 20 μm. D, cell lysates from M2 cells expressing GFP-HDAC5 were analyzed for tubulin acetylation by Western blot. I3A treatment led to the expected phosphorylation of PKCμ and HDAC5 but did not change Ac-tub levels. E, quantification of the Ac-tub levels in C. Data are mean ± S.E.; n = 3; ns, not significant by analysis of variance. F, A7 cells expressing GFP-HDAC5 were treated with I3A alone or with I3A together with the HDAC inhibitor Scriptaid, and the cellular localization of HDAC5 and the levels of Ac-tub in the cells were analyzed by immunocytochemistry. I3A induced translocation of GFP-HDAC5 from the nucleus to the cytoplasm, accompanied by a decrease in the level of Ac-tub. Scriptaid blocked the effect of I3A on the level of Ac-tub without affecting HDAC5 translocation. Scale bar = 20 μm. G, cell lysates from A7 cells expressing GFP-HDAC5 were analyzed for tubulin acetylation by Western blot. I3A treatment induced phosphorylation of PKCμ and HDAC5 and decreased Ac-tub levels. H, quantification of the Ac-tub levels in F. Data are mean ± S.E.; n = 3; **, p < 0.01 by analysis of variance.

