FIGURE 3.
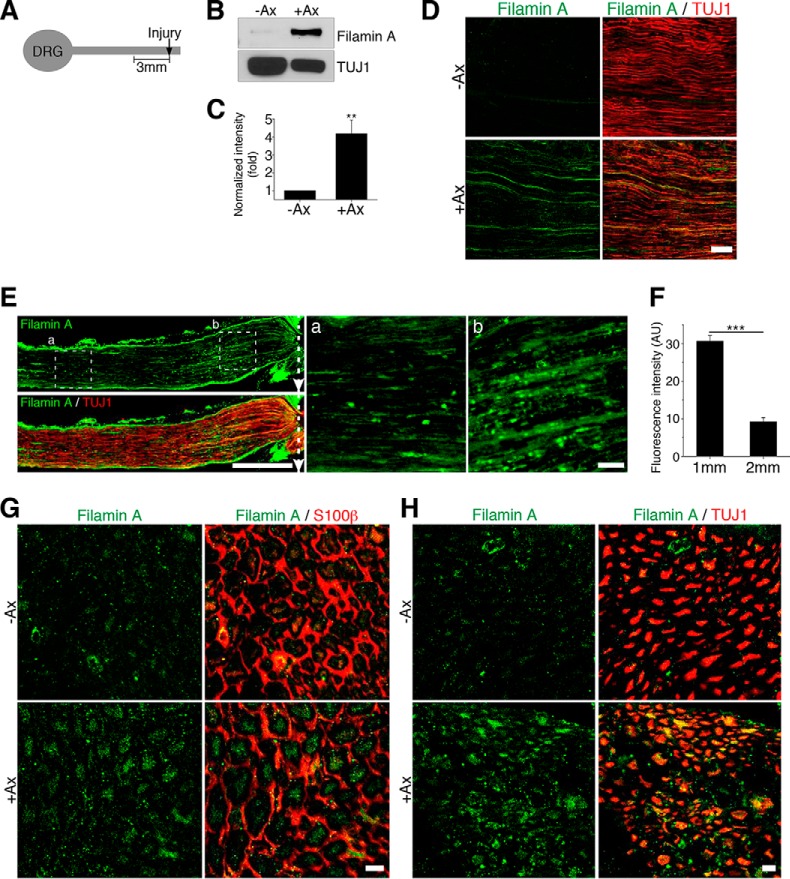
Filamin A levels increase in axons following injury. A, schematic of the injured sciatic nerve segment used for analysis. B, representative Western blot of control sciatic nerve (−Ax) and sciatic nerve 24 h after axotomy (+Ax). C, quantification of the filamin A levels in A. Data are mean ± S.E.; n = 8; **, p < 0.01 by Student's t test. D, longitudinal sections of a control uninjured nerve and an injured segment of the sciatic nerve within the 3-mm proximal to the injury site, stained for filamin A and the axon marker βIII tubulin (TUJ1 antibody). Scale bar = 100 μm. E, representative image of a 2-mm longitudinal section of injured sciatic nerve stained with filamin A and TUJ1 antibody. Scale bar = 500 μm. Dotted boxes (a and b) indicate the magnified regions 1 mm adjacent to the injury site (a) or 2 mm away from the injury site (b). Scale bar = 50 μm. The dotted arrows indicate the injury site. F, quantification of filamin A fluorescence intensity in unit area a and b in E. AU, arbitrary unit per square micrometer. Data are mean ± S.E. n = 15 for 1 mm and 2 mm from the injury site; ***, p < 0.001 by Student's t test. G, cross-sections of control and injured sciatic nerves stained for filamin A and Schwann cell marker S100β antibodies. Scale bar = 10 μm. H, cross-sections of control and injured sciatic nerves stained with filamin A and TUJ1 antibodies. Scale bar = 10 μm.

