FIGURE 7.
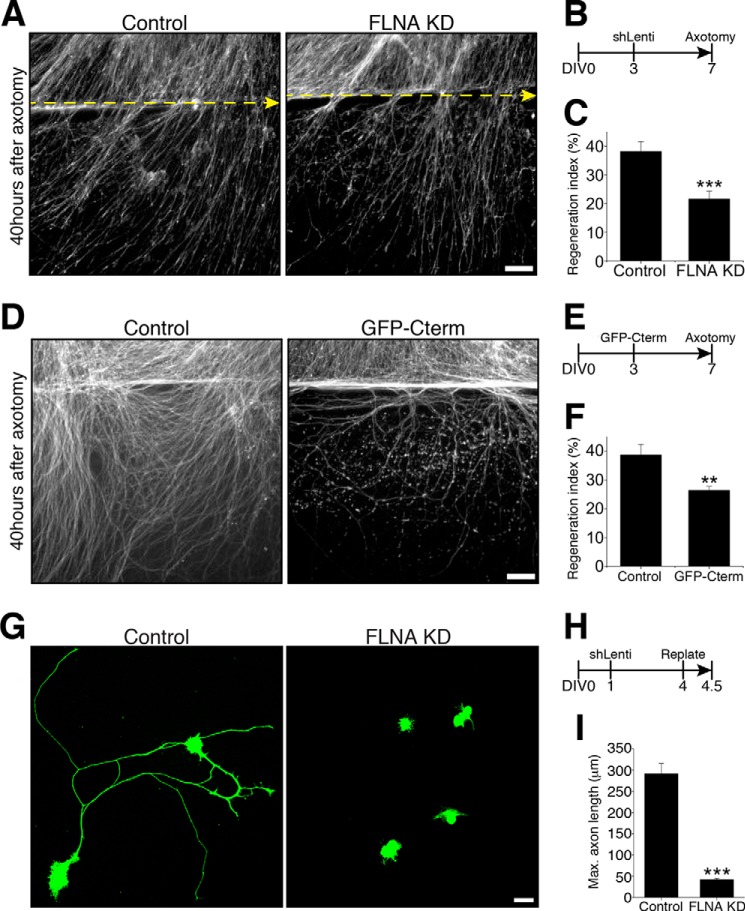
Filamin A contributes to the regulation of axon regeneration. A, representative images of the in vitro regeneration assay of control or FLNA-KD DRG neurons. Scale bar = 100 μm. B, schematic of the experiment time line. DRG neurons were infected with control or shFLNA lentivirus (shLenti) at DIV3, axotomized at DIV7 to start the in vitro regeneration assay, and stained 40 h later for SCG10. C, average regeneration index obtained from regeneration assays (n = 14 for control and 17 for FLNA KD). Data are mean ± S.E. ***, p < 0.001. D, representative images of in vitro regeneration assay of control (FUGW lentivirus) or GFP-Cterm-overexpressing (FUGW-Cterm lentivirus) DRG neurons. Scale bar = 100 μm. E, schematic of the experiment time line. DRG neurons were infected with control or GFP-Cterm lentivirus at DIV3, axotomized at DIV7 to start the in vitro regeneration assay, and stained 40 h later for SCG10. F, average regeneration index obtained from regeneration assays (n = 8 for each condition). Data are mean ± S.E. **, p < 0.01. G, representative images of the neuron replating assay of control or FLNA-KD DRG neurons. Scale bar = 20 μm. H, schematic of the experiment time line. DRG neurons were infected with control or shFLNA lentivirus at DIV1, replated at DIV4, and fixed at 12 h after replating. I, average of maximum axon length obtained from the neuron replating assays (n = 60 for control and 49 for FLNA KD). Data are mean ± S.E. ***, p < 0.001.

