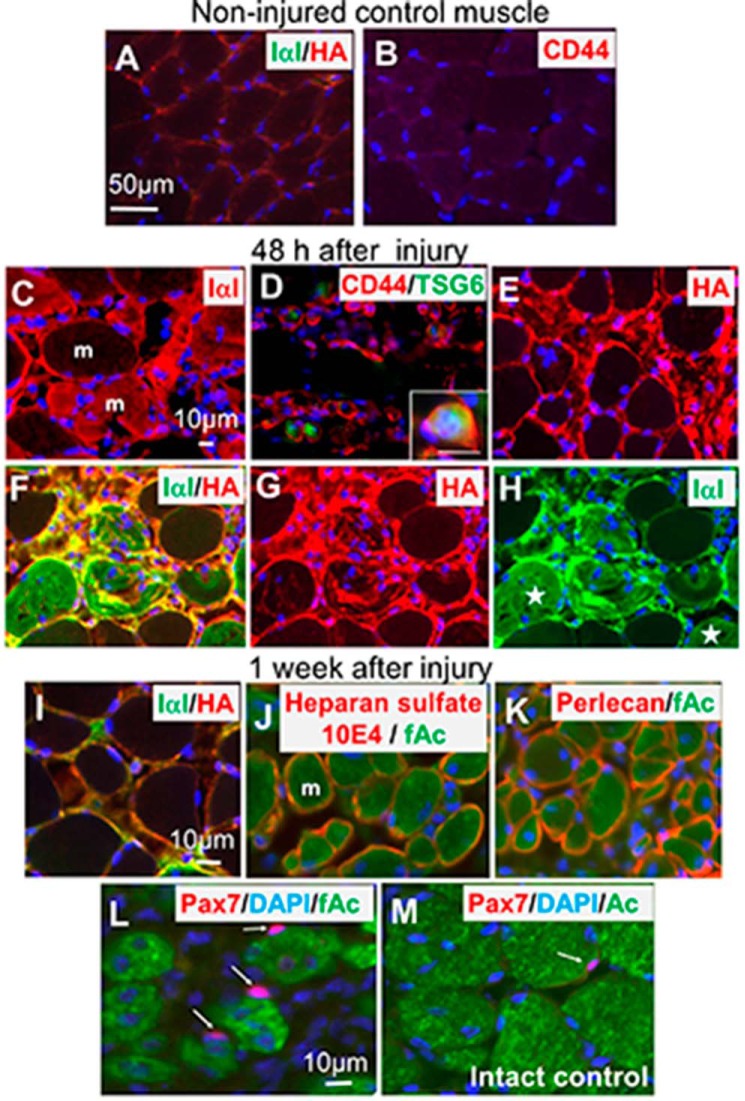
FIGURE 1.
ECM expression before and after injury of skeletal muscle tissue and Pax7 distribution. In the control noninjured TA muscle IαI in green and HA in red were not prominent (A). CD44 was also scarcely observed (B). IαI (C), CD44 (D), and HA (E) in red increased soon after injury and peaked 24–48 h later. Some IαI penetrated damaged muscle fibers shown in red (C). CD44 were expressed in the small cells. Some CD44+ cells (red) also express TSG6 (green) (D). Details of the co-expression are shown in the inset of D. HA is expressed mainly in muscle matrix of the damaged area (E). Frequent co-localization (F) of IαI (green) and HA (red) indicates the SHAP-HA complex formation was demonstrated. In individual images of IαI (G) and HA (H) in F, some IαI penetrated into the damaged muscle fibers (stars) and did not co-localize to HA that mainly located in the areas surrounding the muscle fibers. At the late stage of injury (1–2 weeks after injury), the SHAP-HA network decreased (I). However, heparan sulfate such as 10E4 (J) and perlecan (K) increased, and they surrounded the regenerating skeletal muscles expressing fetal actin (green). Pax7 immunopositive cells (arrows) increased and were closely located at the regenerating muscle fibers expressing fetal actin (green) (L). The population of Pax7+ cells was higher than that of the intact control muscle expressing actin (M). Scale bar in A corresponds to A and B. Scale bar in C corresponds to C–H. Scale bar in insertion D is 10 μm. Scale bar in I corresponds to I–K. Scale bar in L corresponds to L and M. Counter-staining in blue by DAPI indicates nuclei. The mark m in C and J is muscle fiber, which was stained with fetal actin antibody as shown in J and K.

